| __timestamp | AECOM | Cintas Corporation |
|---|---|---|
| Wednesday, January 1, 2014 | 4452451000 | 2637426000 |
| Thursday, January 1, 2015 | 17454692000 | 2555549000 |
| Friday, January 1, 2016 | 16768001000 | 2775588000 |
| Sunday, January 1, 2017 | 17519682000 | 2943086000 |
| Monday, January 1, 2018 | 19504863000 | 3568109000 |
| Tuesday, January 1, 2019 | 19359884000 | 3763715000 |
| Wednesday, January 1, 2020 | 12530416000 | 3851372000 |
| Friday, January 1, 2021 | 12542431000 | 3801689000 |
| Saturday, January 1, 2022 | 12300208000 | 4222213000 |
| Sunday, January 1, 2023 | 13432996000 | 4642401000 |
| Monday, January 1, 2024 | 15021157000 | 4910199000 |
In pursuit of knowledge
In the ever-evolving landscape of corporate finance, understanding cost structures is pivotal. This analysis delves into the cost of revenue trends for Cintas Corporation and AECOM from 2014 to 2024. Over this decade, AECOM's cost of revenue has shown a significant upward trajectory, peaking at approximately $19.5 billion in 2018, before stabilizing around $15 billion in 2024. This represents a 237% increase from its 2014 figures. Meanwhile, Cintas Corporation has experienced a steady rise, with costs growing by 86% from 2014 to 2024, reaching nearly $4.9 billion. This growth reflects Cintas's strategic expansion and operational efficiency. The data highlights AECOM's larger scale and higher operational costs compared to Cintas, offering insights into their respective market strategies. As businesses navigate economic challenges, these insights are crucial for stakeholders aiming to optimize financial performance.
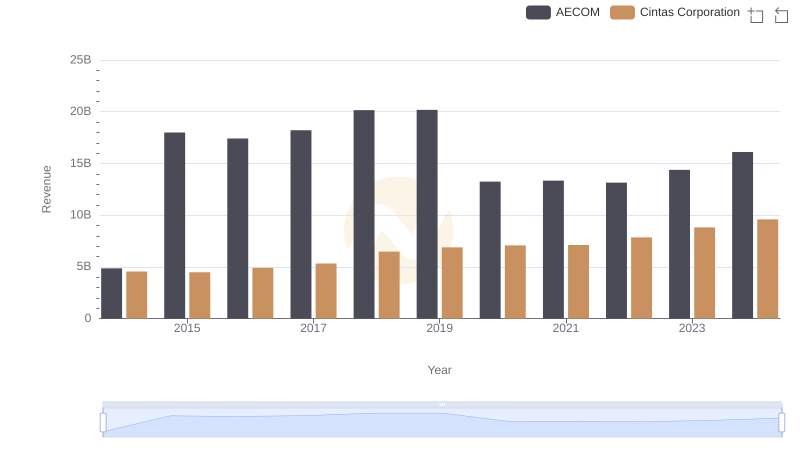
Breaking Down Revenue Trends: Cintas Corporation vs AECOM
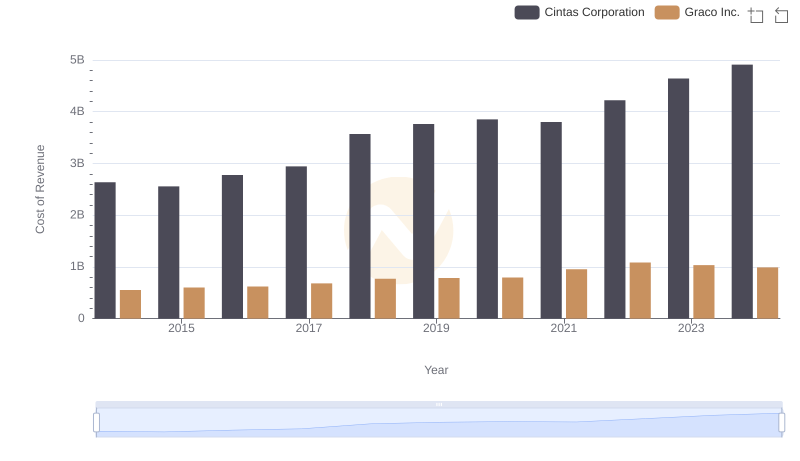
Analyzing Cost of Revenue: Cintas Corporation and Graco Inc.
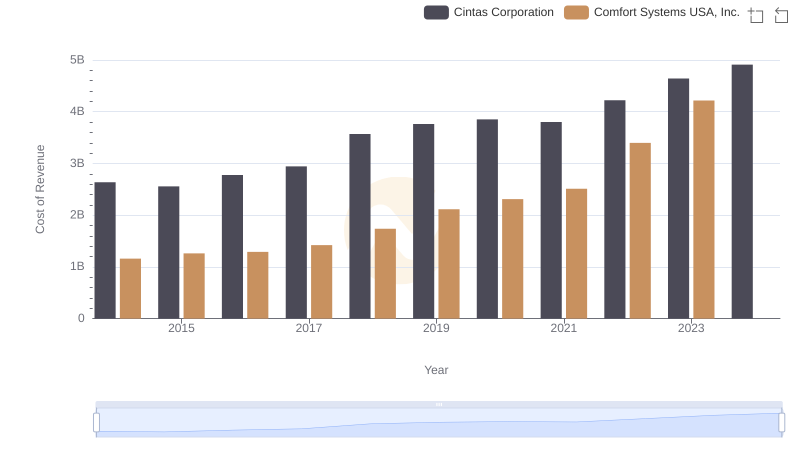
Cost of Revenue Comparison: Cintas Corporation vs Comfort Systems USA, Inc.
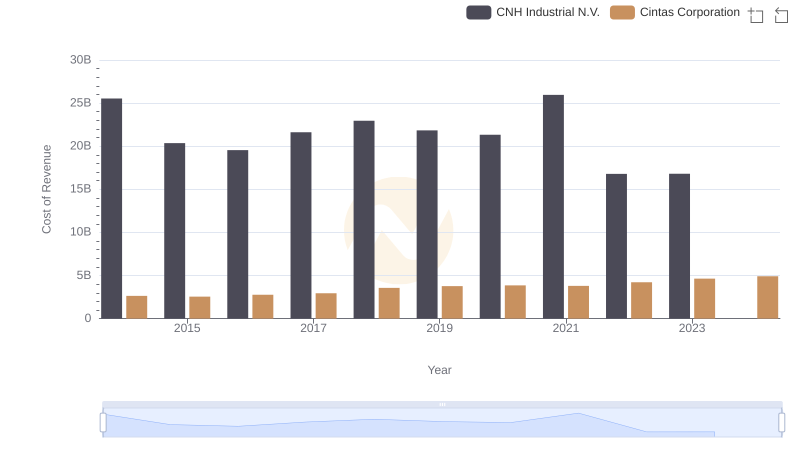
Cost of Revenue: Key Insights for Cintas Corporation and CNH Industrial N.V.
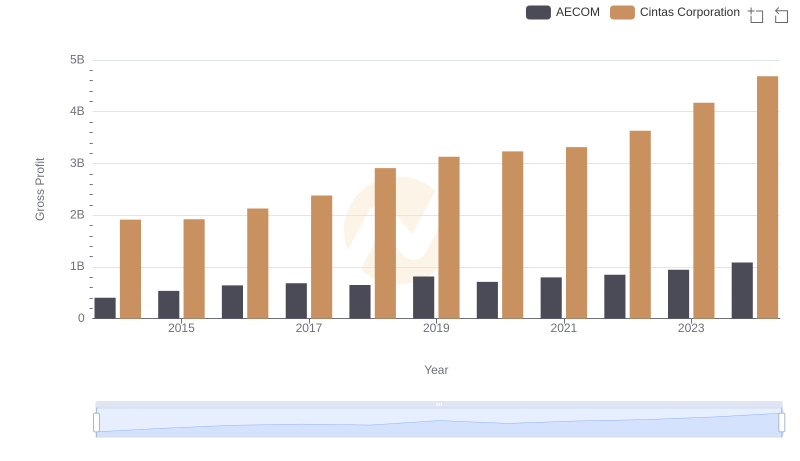
Gross Profit Trends Compared: Cintas Corporation vs AECOM
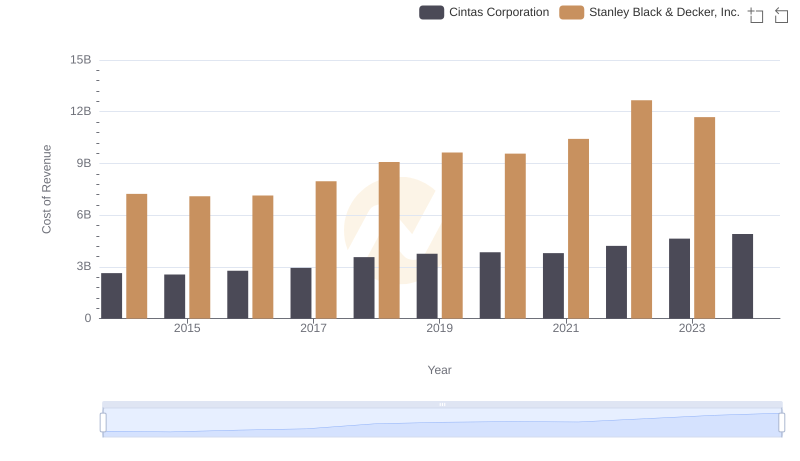
Analyzing Cost of Revenue: Cintas Corporation and Stanley Black & Decker, Inc.
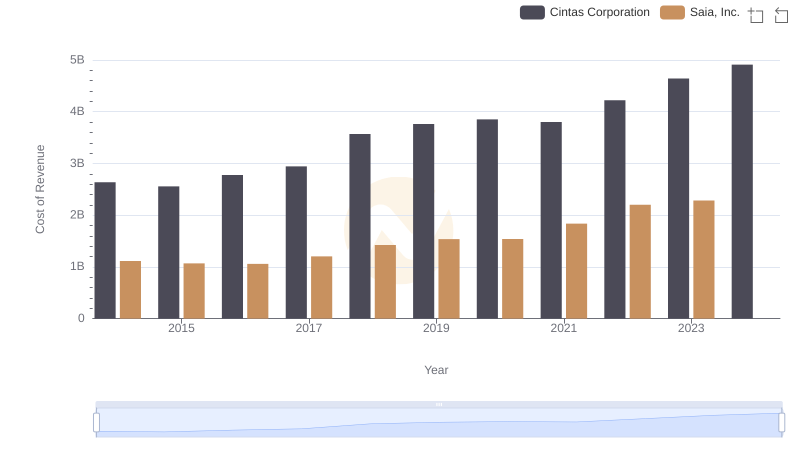
Cost of Revenue Trends: Cintas Corporation vs Saia, Inc.
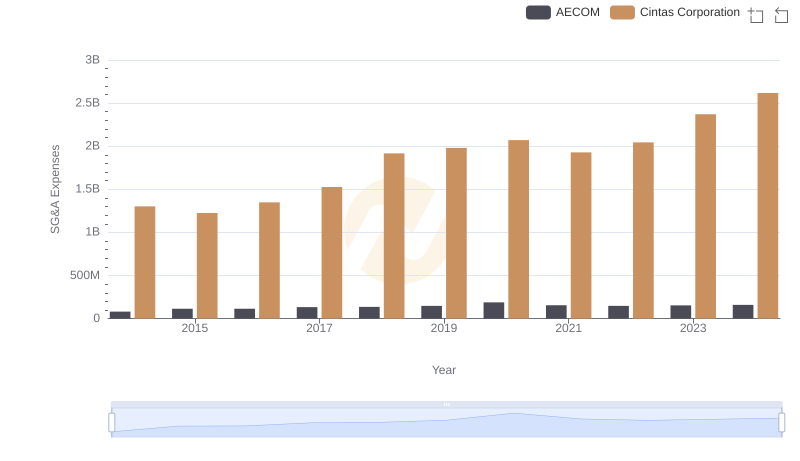
SG&A Efficiency Analysis: Comparing Cintas Corporation and AECOM
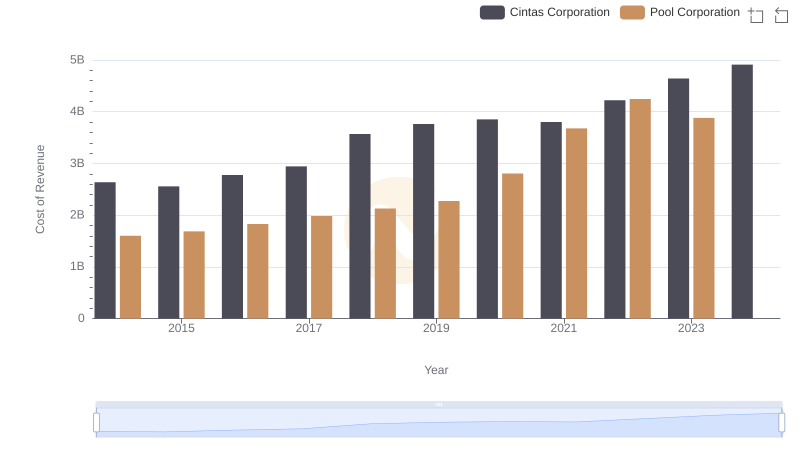
Cost of Revenue: Key Insights for Cintas Corporation and Pool Corporation
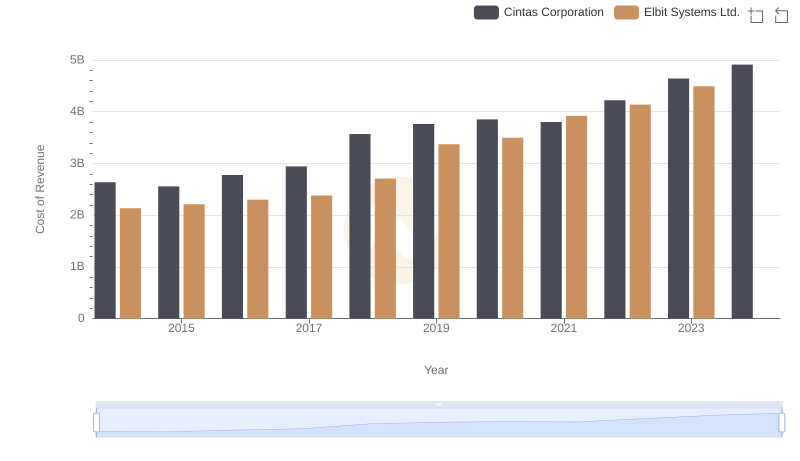
Analyzing Cost of Revenue: Cintas Corporation and Elbit Systems Ltd.
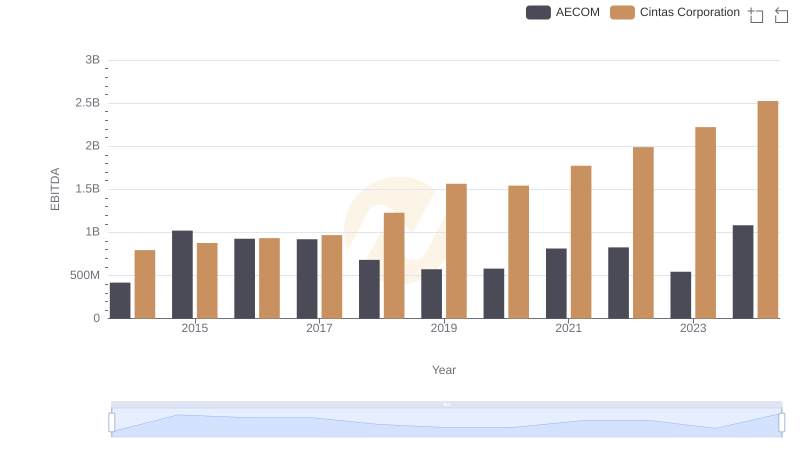
Professional EBITDA Benchmarking: Cintas Corporation vs AECOM