| __timestamp | AECOM | Cintas Corporation |
|---|---|---|
| Wednesday, January 1, 2014 | 4855627000 | 4551812000 |
| Thursday, January 1, 2015 | 17989880000 | 4476886000 |
| Friday, January 1, 2016 | 17410825000 | 4905458000 |
| Sunday, January 1, 2017 | 18203402000 | 5323381000 |
| Monday, January 1, 2018 | 20155512000 | 6476632000 |
| Tuesday, January 1, 2019 | 20173329000 | 6892303000 |
| Wednesday, January 1, 2020 | 13239976000 | 7085120000 |
| Friday, January 1, 2021 | 13340852000 | 7116340000 |
| Saturday, January 1, 2022 | 13148182000 | 7854459000 |
| Sunday, January 1, 2023 | 14378461000 | 8815769000 |
| Monday, January 1, 2024 | 16105498000 | 9596615000 |
Data in motion
In the competitive landscape of corporate America, understanding revenue trends is crucial. This analysis focuses on the revenue trajectories of Cintas Corporation and AECOM from 2014 to 2024. Over this decade, AECOM's revenue peaked in 2018 at approximately $20 billion, showcasing a robust growth of around 315% from its 2014 figures. However, the subsequent years saw a decline, with 2020 marking a significant dip to about $13 billion, likely due to global economic challenges. In contrast, Cintas Corporation demonstrated a steady upward trend, with revenue increasing by over 110% from 2014 to 2024, reaching nearly $9.6 billion. This consistent growth highlights Cintas's resilience and strategic market positioning. As we move forward, these trends offer valuable insights into the operational strategies and market adaptability of these industry giants.
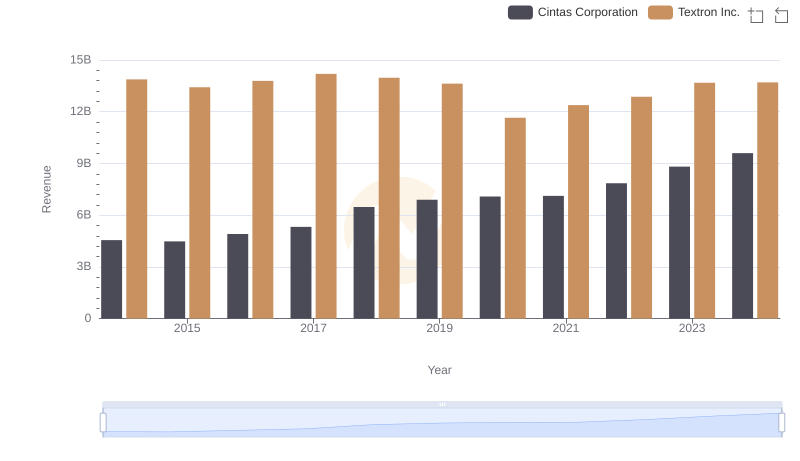
Cintas Corporation vs Textron Inc.: Annual Revenue Growth Compared
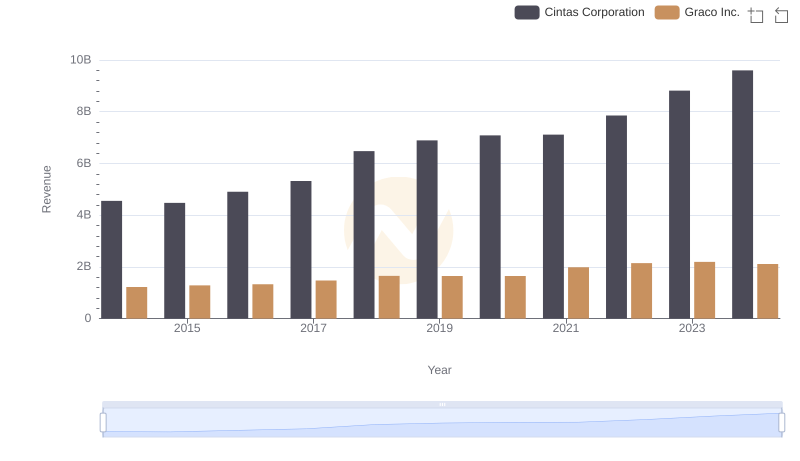
Cintas Corporation and Graco Inc.: A Comprehensive Revenue Analysis
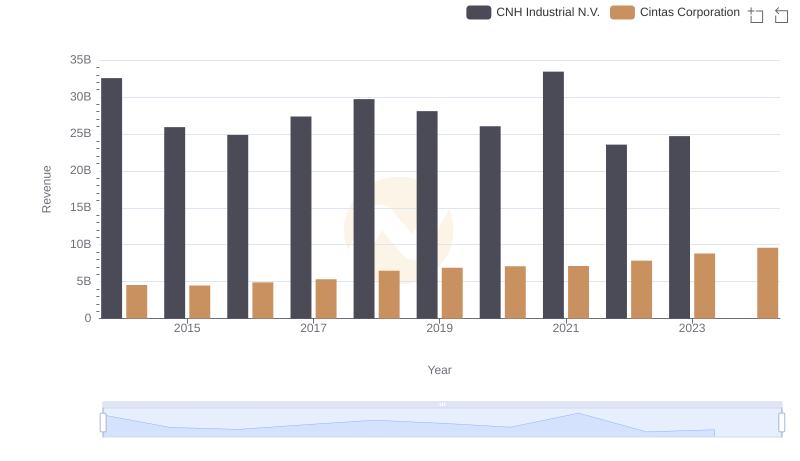
Cintas Corporation and CNH Industrial N.V.: A Comprehensive Revenue Analysis
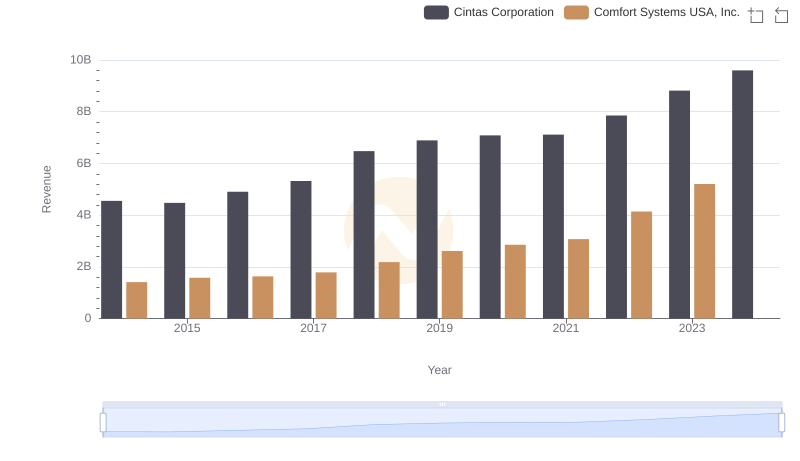
Cintas Corporation and Comfort Systems USA, Inc.: A Comprehensive Revenue Analysis
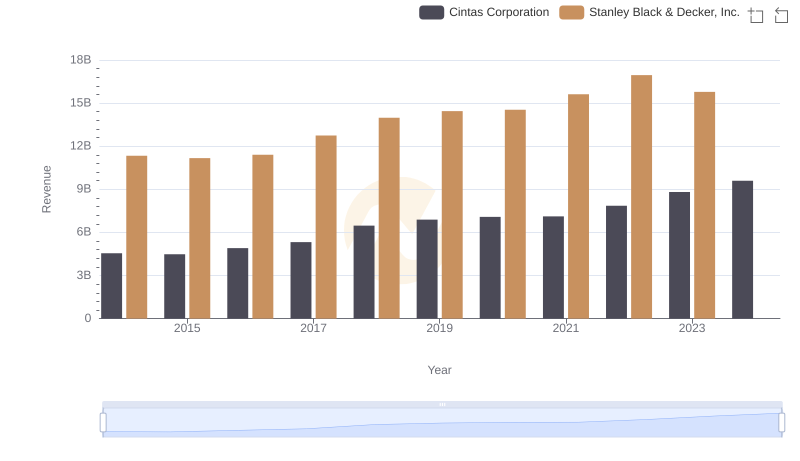
Breaking Down Revenue Trends: Cintas Corporation vs Stanley Black & Decker, Inc.
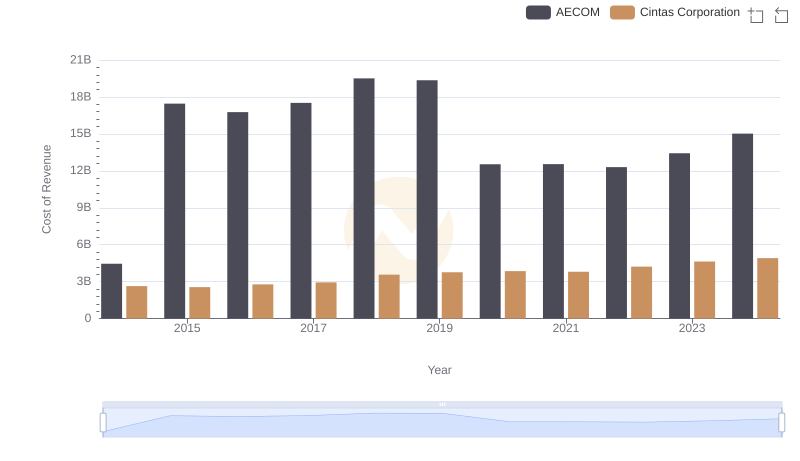
Cost Insights: Breaking Down Cintas Corporation and AECOM's Expenses
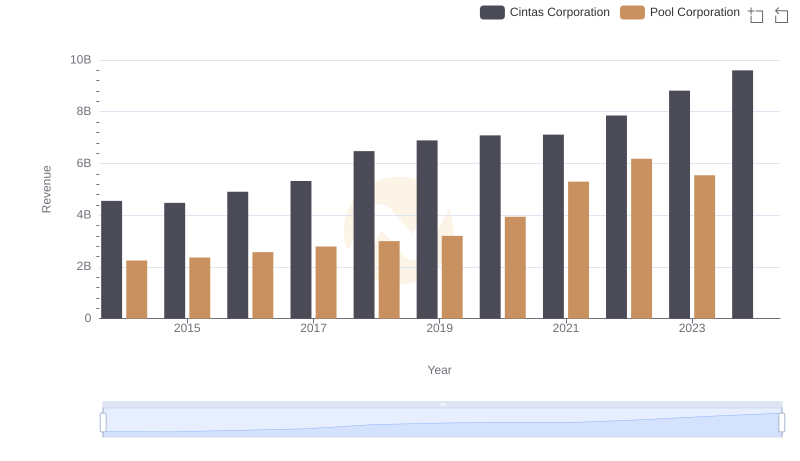
Who Generates More Revenue? Cintas Corporation or Pool Corporation
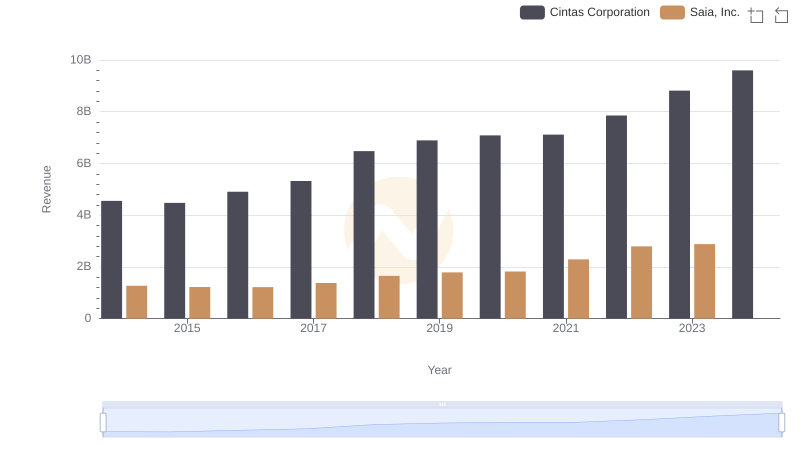
Cintas Corporation vs Saia, Inc.: Examining Key Revenue Metrics
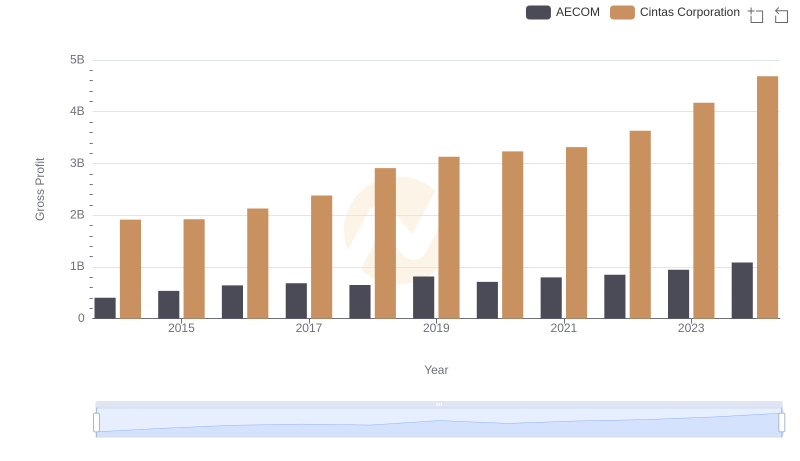
Gross Profit Trends Compared: Cintas Corporation vs AECOM
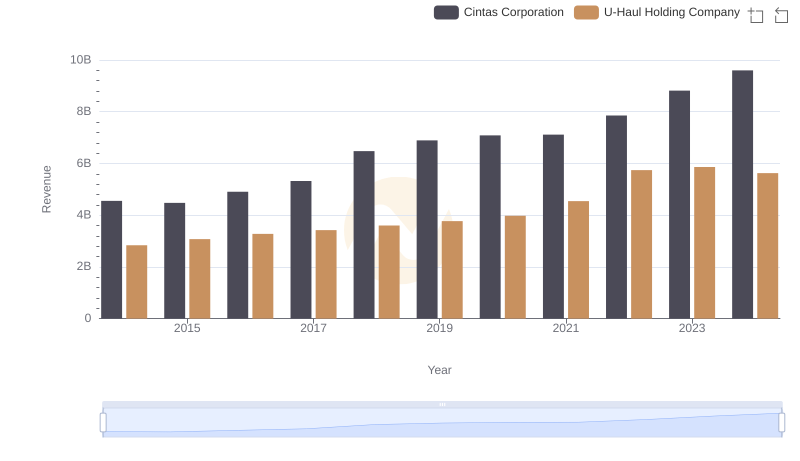
Who Generates More Revenue? Cintas Corporation or U-Haul Holding Company
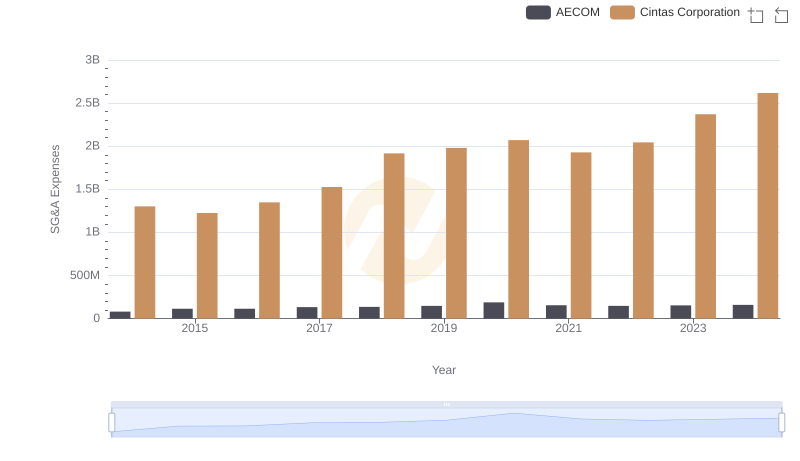
SG&A Efficiency Analysis: Comparing Cintas Corporation and AECOM
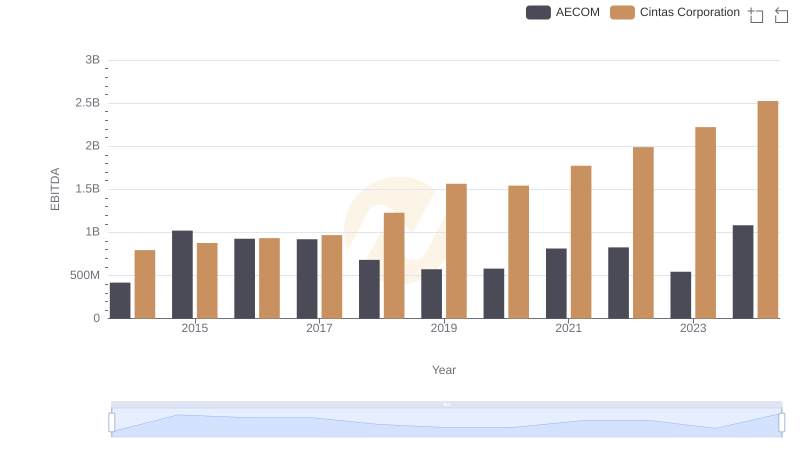
Professional EBITDA Benchmarking: Cintas Corporation vs AECOM