| __timestamp | Cintas Corporation | Comfort Systems USA, Inc. |
|---|---|---|
| Wednesday, January 1, 2014 | 2637426000 | 1161024000 |
| Thursday, January 1, 2015 | 2555549000 | 1262390000 |
| Friday, January 1, 2016 | 2775588000 | 1290331000 |
| Sunday, January 1, 2017 | 2943086000 | 1421641000 |
| Monday, January 1, 2018 | 3568109000 | 1736600000 |
| Tuesday, January 1, 2019 | 3763715000 | 2113334000 |
| Wednesday, January 1, 2020 | 3851372000 | 2309676000 |
| Friday, January 1, 2021 | 3801689000 | 2510429000 |
| Saturday, January 1, 2022 | 4222213000 | 3398756000 |
| Sunday, January 1, 2023 | 4642401000 | 4216251000 |
| Monday, January 1, 2024 | 4910199000 |
Unleashing insights
In the competitive landscape of the U.S. service industry, Cintas Corporation and Comfort Systems USA, Inc. have been pivotal players. Over the past decade, Cintas has consistently outpaced Comfort Systems in terms of cost of revenue, reflecting its expansive operations and market reach. From 2014 to 2023, Cintas saw a remarkable 86% increase in its cost of revenue, peaking at $4.64 billion in 2023. In contrast, Comfort Systems USA, Inc. experienced a 263% surge, reaching $4.22 billion in the same year. This rapid growth highlights Comfort Systems' aggressive expansion and adaptation strategies. However, data for 2024 is incomplete, with Comfort Systems' figures missing, leaving room for speculation on its future trajectory. As these companies continue to evolve, their financial strategies will be crucial in shaping their competitive edge in the industry.
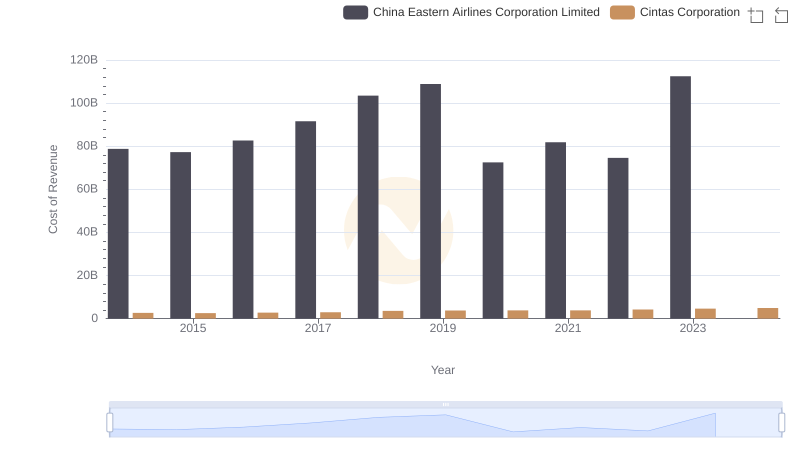
Analyzing Cost of Revenue: Cintas Corporation and China Eastern Airlines Corporation Limited
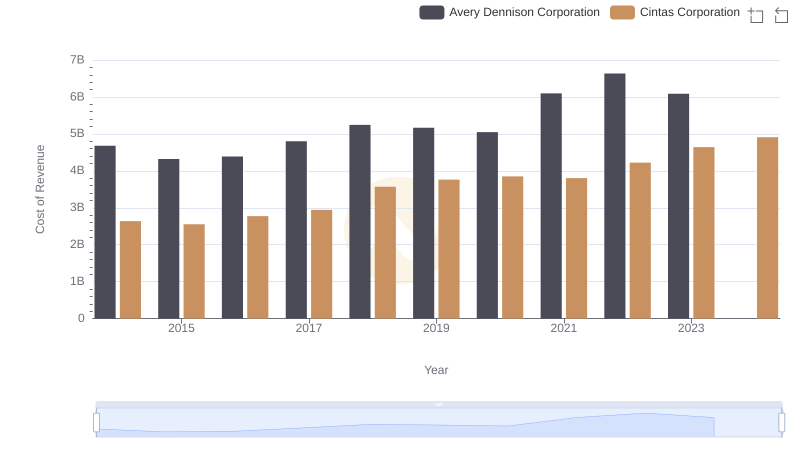
Cost of Revenue: Key Insights for Cintas Corporation and Avery Dennison Corporation
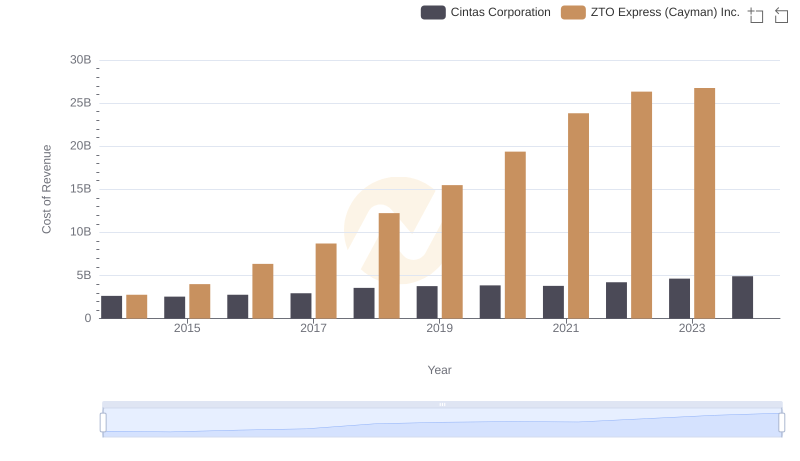
Cost of Revenue Trends: Cintas Corporation vs ZTO Express (Cayman) Inc.
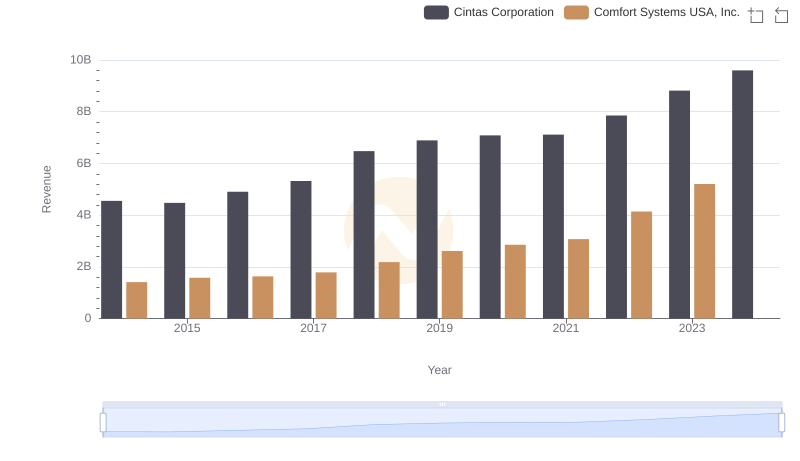
Cintas Corporation and Comfort Systems USA, Inc.: A Comprehensive Revenue Analysis
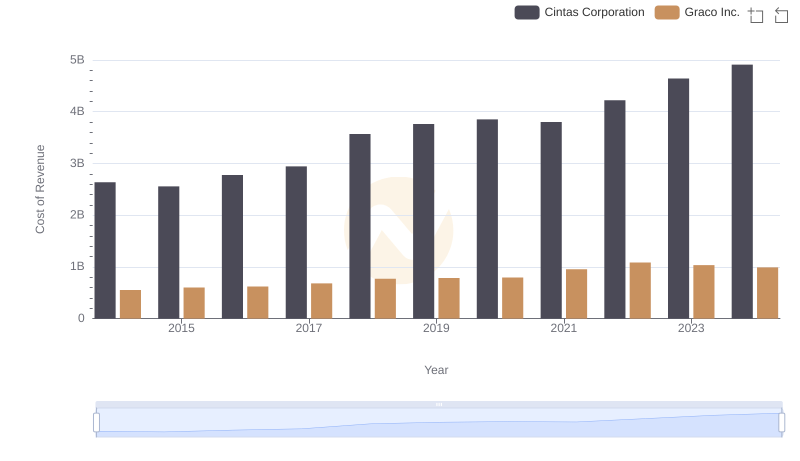
Analyzing Cost of Revenue: Cintas Corporation and Graco Inc.
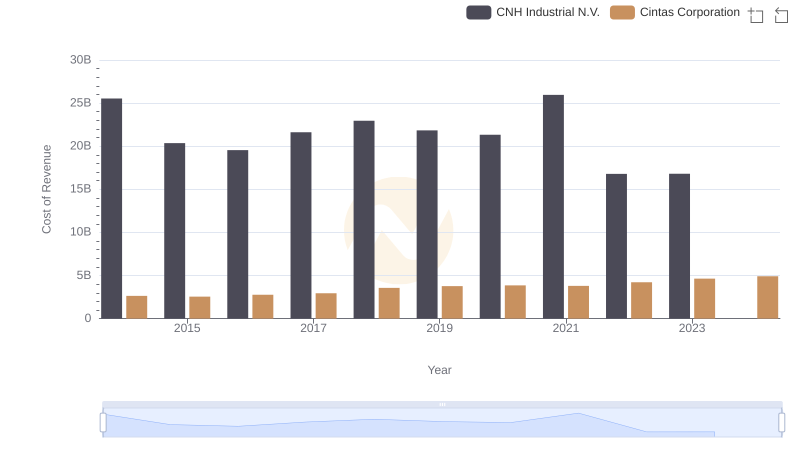
Cost of Revenue: Key Insights for Cintas Corporation and CNH Industrial N.V.
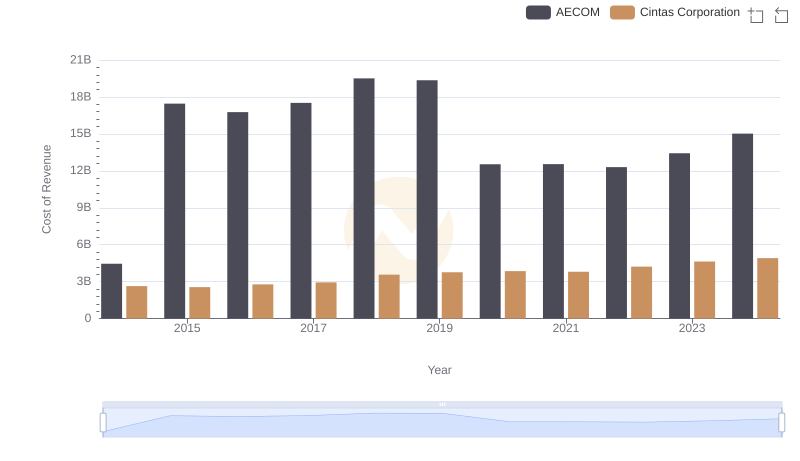
Cost Insights: Breaking Down Cintas Corporation and AECOM's Expenses

Key Insights on Gross Profit: Cintas Corporation vs Comfort Systems USA, Inc.
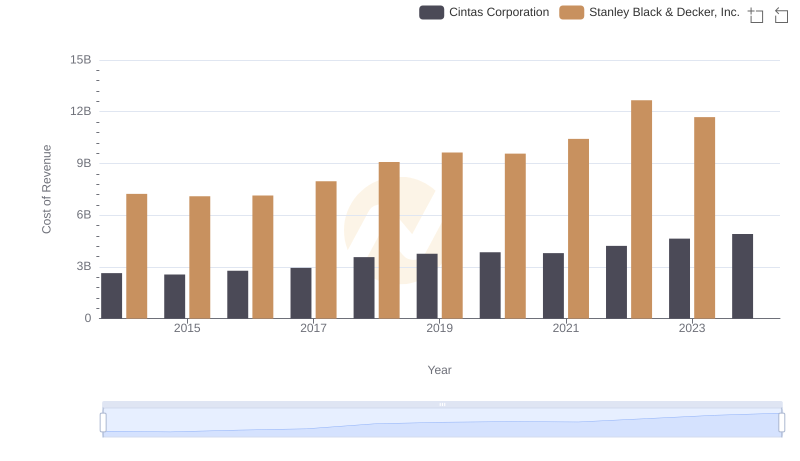
Analyzing Cost of Revenue: Cintas Corporation and Stanley Black & Decker, Inc.
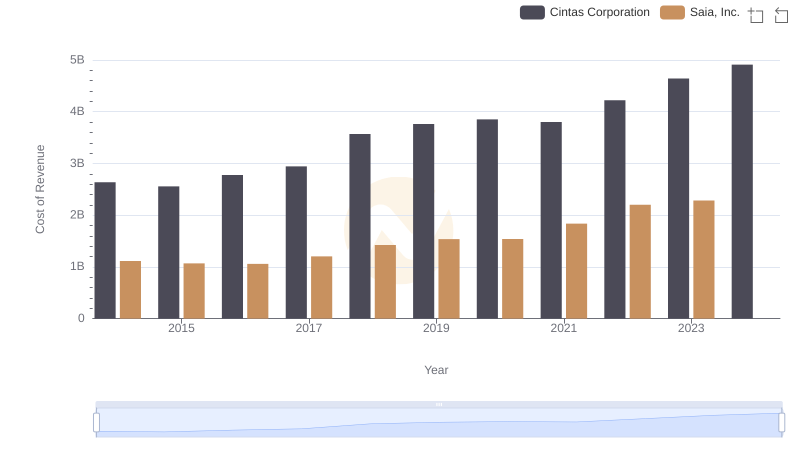
Cost of Revenue Trends: Cintas Corporation vs Saia, Inc.

Breaking Down SG&A Expenses: Cintas Corporation vs Comfort Systems USA, Inc.
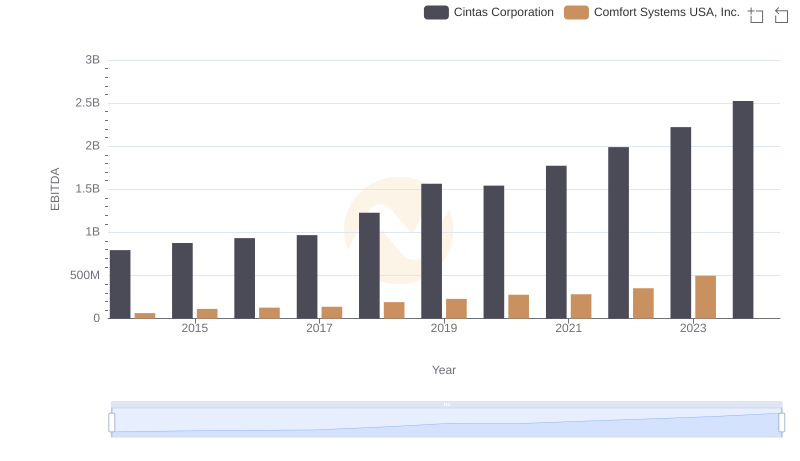
EBITDA Performance Review: Cintas Corporation vs Comfort Systems USA, Inc.