| __timestamp | AECOM | Cintas Corporation |
|---|---|---|
| Wednesday, January 1, 2014 | 403176000 | 1914386000 |
| Thursday, January 1, 2015 | 535188000 | 1921337000 |
| Friday, January 1, 2016 | 642824000 | 2129870000 |
| Sunday, January 1, 2017 | 683720000 | 2380295000 |
| Monday, January 1, 2018 | 650649000 | 2908523000 |
| Tuesday, January 1, 2019 | 813445000 | 3128588000 |
| Wednesday, January 1, 2020 | 709560000 | 3233748000 |
| Friday, January 1, 2021 | 798421000 | 3314651000 |
| Saturday, January 1, 2022 | 847974000 | 3632246000 |
| Sunday, January 1, 2023 | 945465000 | 4173368000 |
| Monday, January 1, 2024 | 1084341000 | 4686416000 |
Unlocking the unknown
In the competitive landscape of corporate America, understanding financial trends is crucial. This analysis delves into the gross profit trajectories of Cintas Corporation and AECOM from 2014 to 2024. Over this decade, Cintas Corporation has consistently outperformed AECOM, showcasing a robust growth trajectory. Starting in 2014, Cintas's gross profit was nearly five times that of AECOM. By 2024, Cintas's gross profit surged by approximately 145%, while AECOM's increased by about 170%, indicating a significant catch-up.
These trends underscore the dynamic nature of the industry, where strategic decisions and market conditions play pivotal roles in shaping financial outcomes.
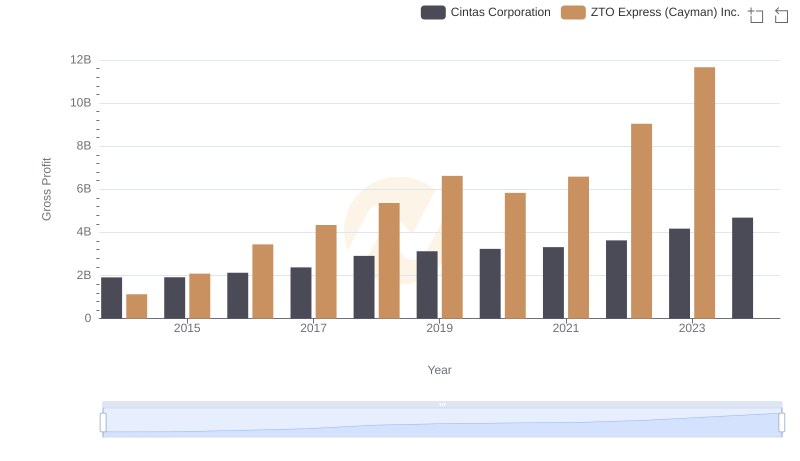
Cintas Corporation vs ZTO Express (Cayman) Inc.: A Gross Profit Performance Breakdown
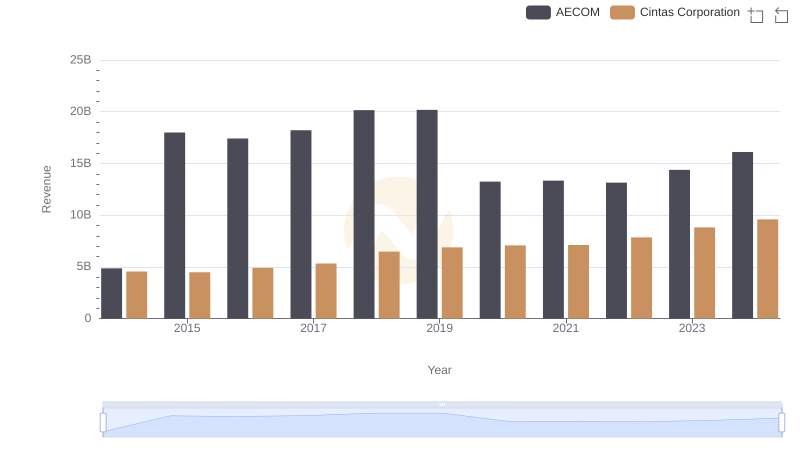
Breaking Down Revenue Trends: Cintas Corporation vs AECOM
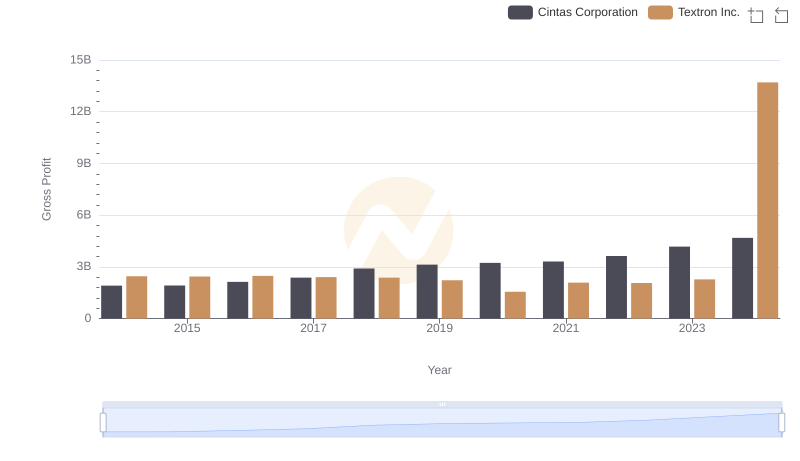
Key Insights on Gross Profit: Cintas Corporation vs Textron Inc.
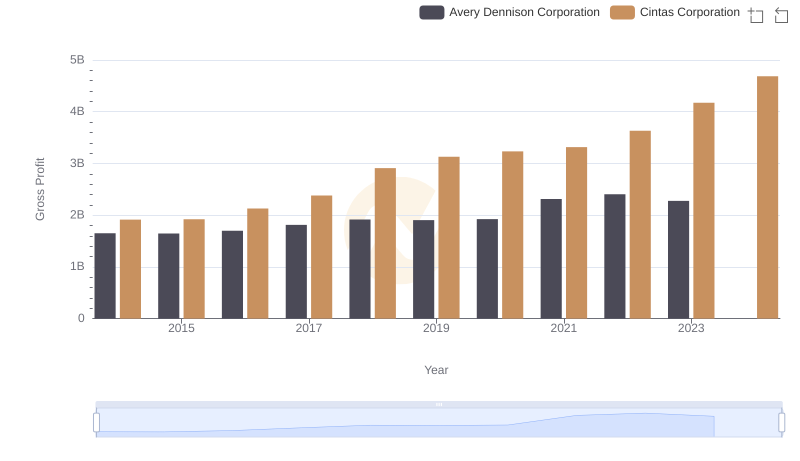
Who Generates Higher Gross Profit? Cintas Corporation or Avery Dennison Corporation
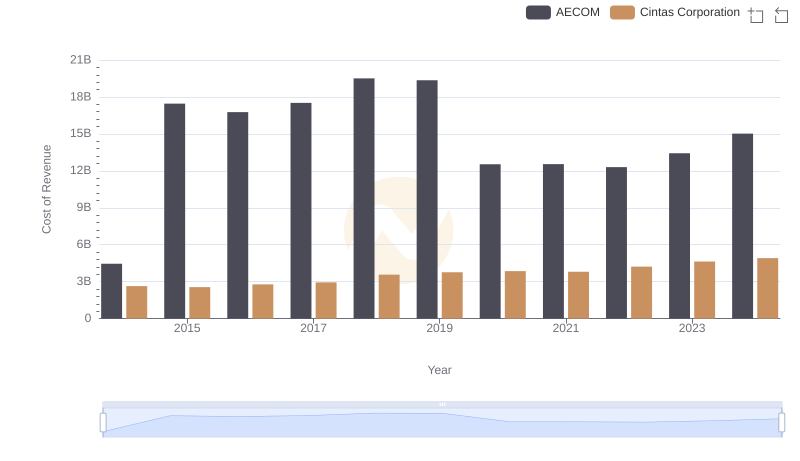
Cost Insights: Breaking Down Cintas Corporation and AECOM's Expenses
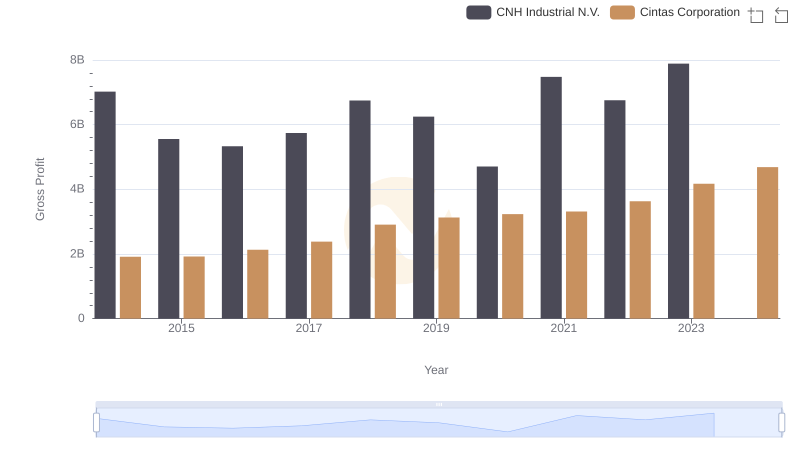
Who Generates Higher Gross Profit? Cintas Corporation or CNH Industrial N.V.

Gross Profit Analysis: Comparing Cintas Corporation and Graco Inc.

Key Insights on Gross Profit: Cintas Corporation vs Comfort Systems USA, Inc.
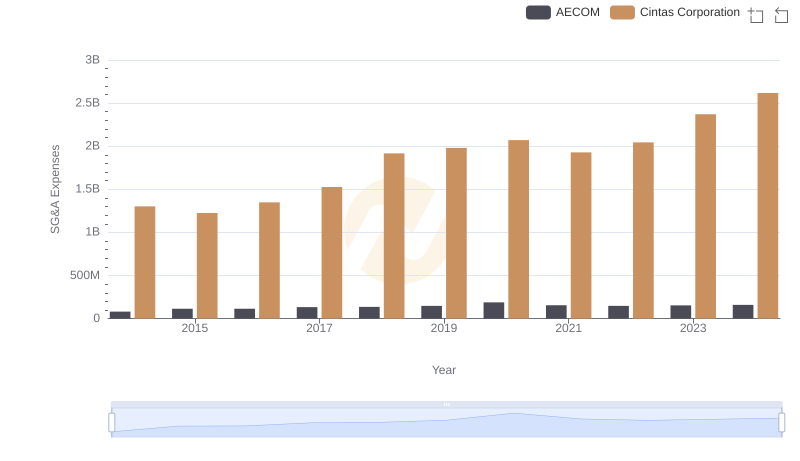
SG&A Efficiency Analysis: Comparing Cintas Corporation and AECOM
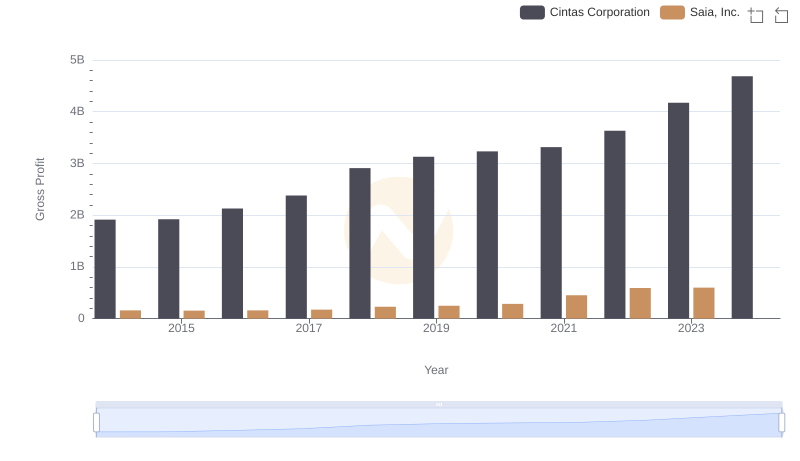
Who Generates Higher Gross Profit? Cintas Corporation or Saia, Inc.
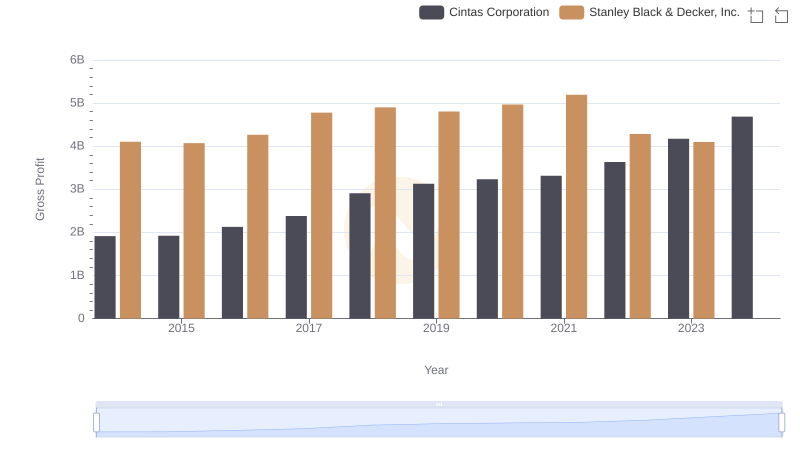
Key Insights on Gross Profit: Cintas Corporation vs Stanley Black & Decker, Inc.
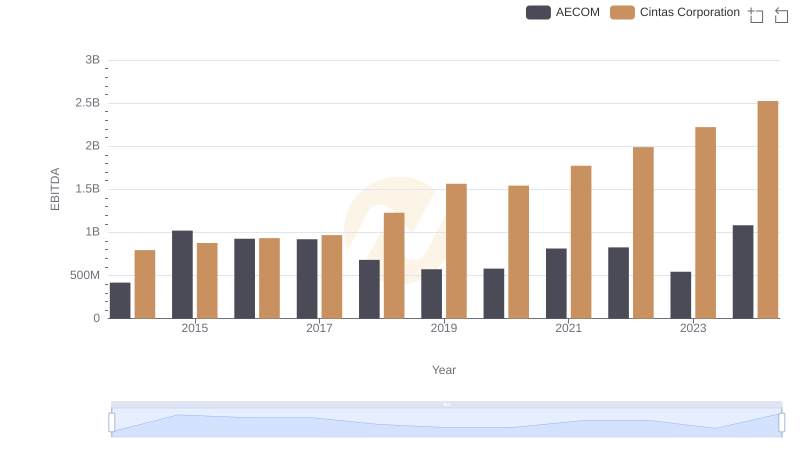
Professional EBITDA Benchmarking: Cintas Corporation vs AECOM