| __timestamp | Cintas Corporation | Stanley Black & Decker, Inc. |
|---|---|---|
| Wednesday, January 1, 2014 | 2637426000 | 7235900000 |
| Thursday, January 1, 2015 | 2555549000 | 7099800000 |
| Friday, January 1, 2016 | 2775588000 | 7139700000 |
| Sunday, January 1, 2017 | 2943086000 | 7969200000 |
| Monday, January 1, 2018 | 3568109000 | 9080500000 |
| Tuesday, January 1, 2019 | 3763715000 | 9636700000 |
| Wednesday, January 1, 2020 | 3851372000 | 9566700000 |
| Friday, January 1, 2021 | 3801689000 | 10423000000 |
| Saturday, January 1, 2022 | 4222213000 | 12663300000 |
| Sunday, January 1, 2023 | 4642401000 | 11683100000 |
| Monday, January 1, 2024 | 4910199000 | 10851300000 |
Unlocking the unknown
In the ever-evolving landscape of industrial services and tools, Cintas Corporation and Stanley Black & Decker, Inc. stand as titans. From 2014 to 2023, Cintas Corporation's cost of revenue surged by approximately 86%, reflecting its robust growth and strategic expansions. Meanwhile, Stanley Black & Decker, Inc. experienced a 61% increase in the same period, underscoring its resilience and market adaptability.
Cintas Corporation's cost of revenue consistently climbed, peaking in 2024, while Stanley Black & Decker, Inc. reached its zenith in 2022. Notably, the data for 2024 is incomplete for Stanley Black & Decker, Inc., hinting at potential shifts in strategy or market conditions. This analysis offers a window into the financial dynamics of these industry leaders, providing valuable insights for investors and market analysts alike.
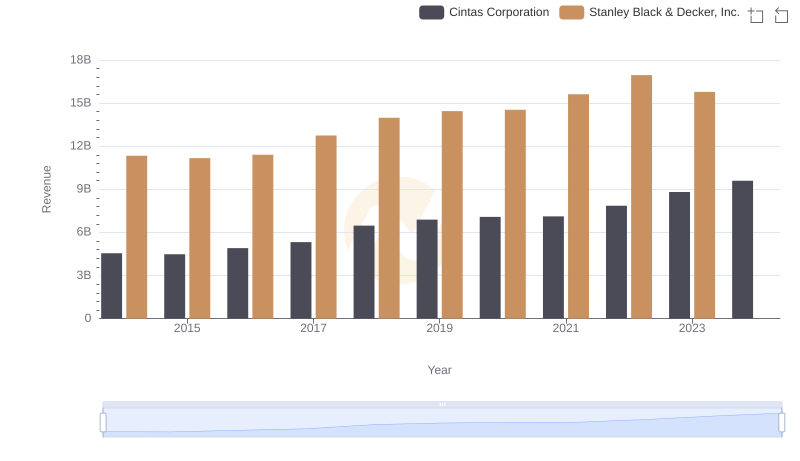
Cintas Corporation or Stanley Black & Decker, Inc.: Who Leads in Yearly Revenue?
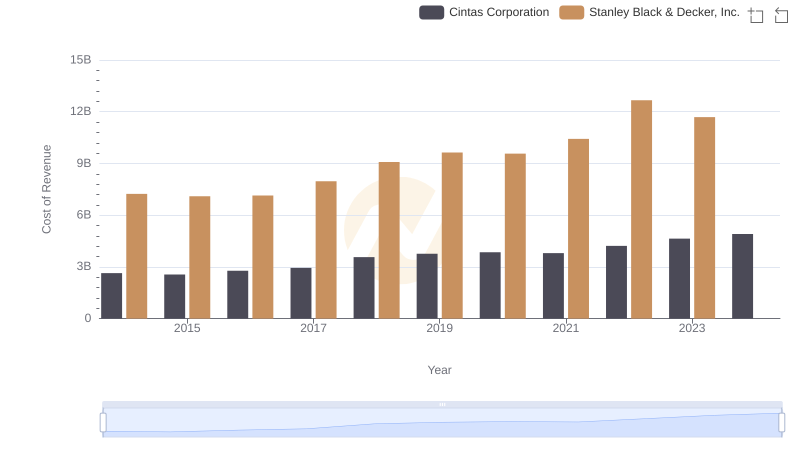
Cost of Revenue: Key Insights for Cintas Corporation and Stanley Black & Decker, Inc.

Key Insights on Gross Profit: Cintas Corporation vs Stanley Black & Decker, Inc.

Operational Costs Compared: SG&A Analysis of Cintas Corporation and Stanley Black & Decker, Inc.
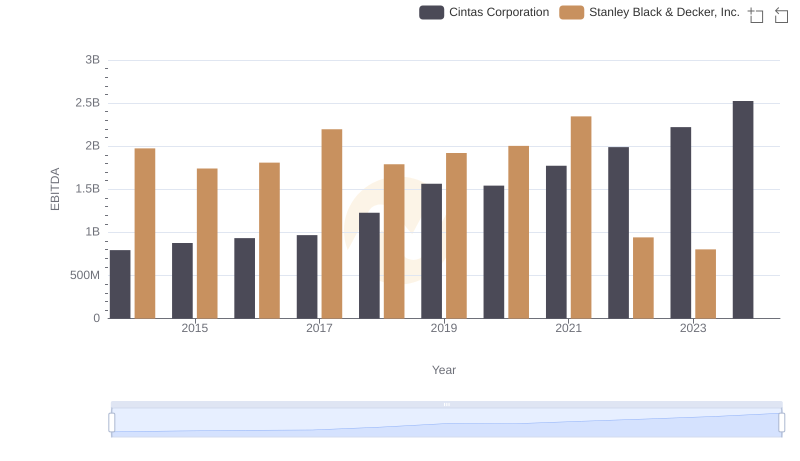
Cintas Corporation vs Stanley Black & Decker, Inc.: In-Depth EBITDA Performance Comparison

Breaking Down Revenue Trends: Cintas Corporation vs Stanley Black & Decker, Inc.
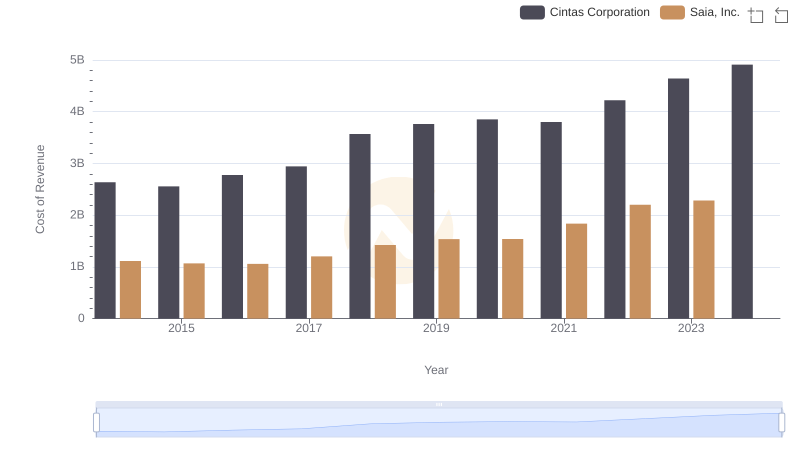
Cost of Revenue Trends: Cintas Corporation vs Saia, Inc.
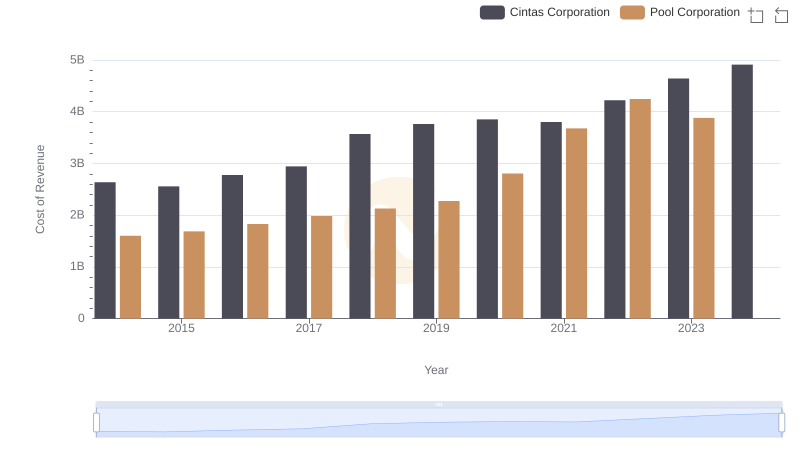
Cost of Revenue: Key Insights for Cintas Corporation and Pool Corporation
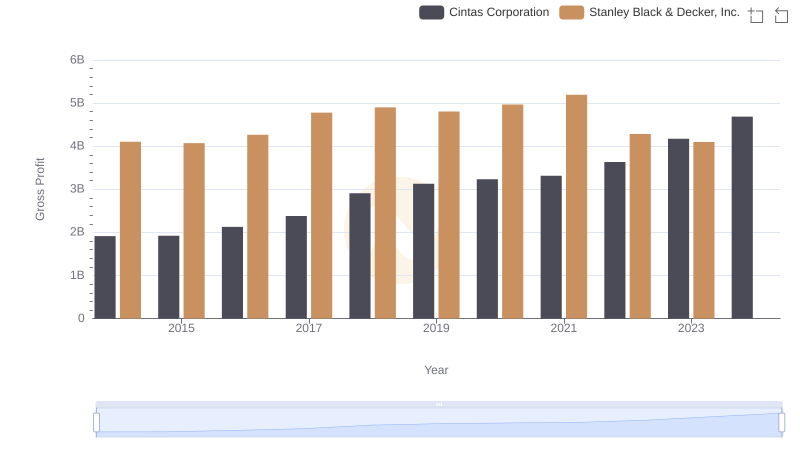
Key Insights on Gross Profit: Cintas Corporation vs Stanley Black & Decker, Inc.
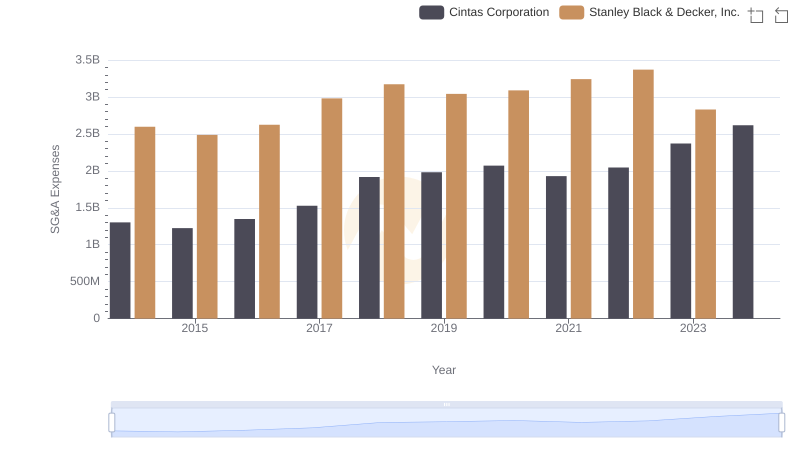
Cintas Corporation or Stanley Black & Decker, Inc.: Who Manages SG&A Costs Better?

Comprehensive EBITDA Comparison: Cintas Corporation vs Stanley Black & Decker, Inc.