| __timestamp | CNH Industrial N.V. | Cintas Corporation |
|---|---|---|
| Wednesday, January 1, 2014 | 25534000000 | 2637426000 |
| Thursday, January 1, 2015 | 20357000000 | 2555549000 |
| Friday, January 1, 2016 | 19539000000 | 2775588000 |
| Sunday, January 1, 2017 | 21621000000 | 2943086000 |
| Monday, January 1, 2018 | 22958000000 | 3568109000 |
| Tuesday, January 1, 2019 | 21832000000 | 3763715000 |
| Wednesday, January 1, 2020 | 21327000000 | 3851372000 |
| Friday, January 1, 2021 | 25951000000 | 3801689000 |
| Saturday, January 1, 2022 | 16797000000 | 4222213000 |
| Sunday, January 1, 2023 | 16805000000 | 4642401000 |
| Monday, January 1, 2024 | 4910199000 |
Data in motion
In the ever-evolving landscape of industrial and corporate services, understanding cost structures is pivotal. Cintas Corporation and CNH Industrial N.V. have shown intriguing trends in their cost of revenue from 2014 to 2023. Cintas Corporation, a leader in corporate identity uniforms, has seen a steady increase in its cost of revenue, peaking at approximately $4.9 billion in 2023, marking a 90% rise since 2014. Meanwhile, CNH Industrial N.V., a global leader in capital goods, experienced fluctuations, with a notable peak in 2021 at $25.95 billion, before a significant drop to $16.8 billion in 2023. This divergence highlights the resilience of Cintas in maintaining growth, while CNH Industrial faces challenges in stabilizing its cost structure. The absence of data for CNH Industrial in 2024 suggests potential reporting delays or strategic shifts.
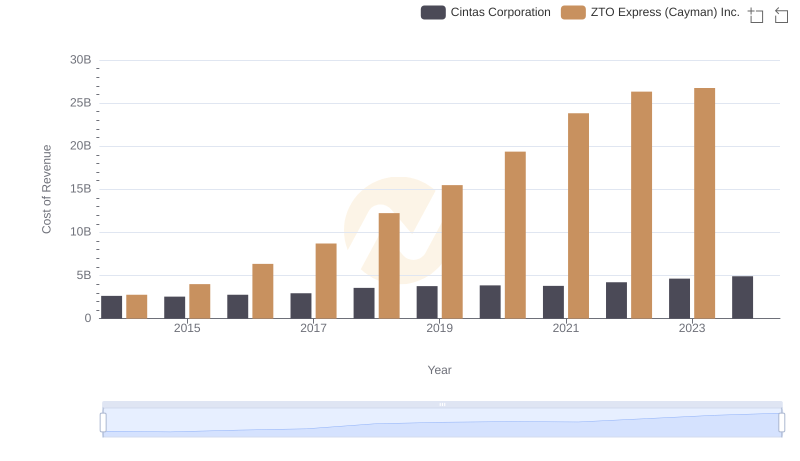
Cost of Revenue Trends: Cintas Corporation vs ZTO Express (Cayman) Inc.
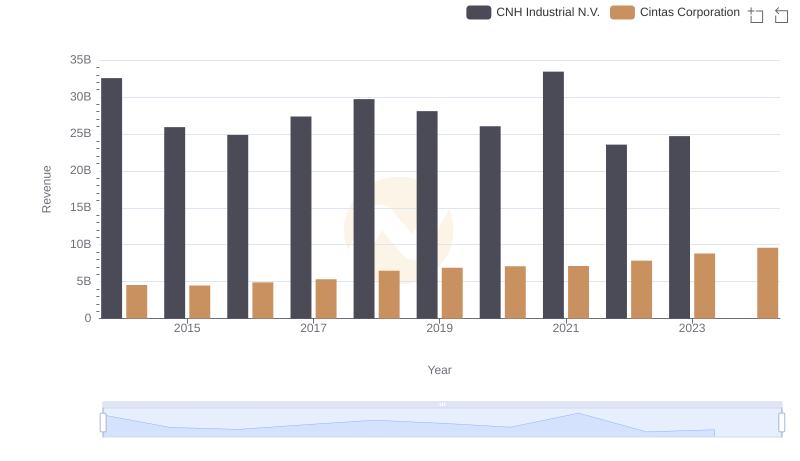
Cintas Corporation and CNH Industrial N.V.: A Comprehensive Revenue Analysis
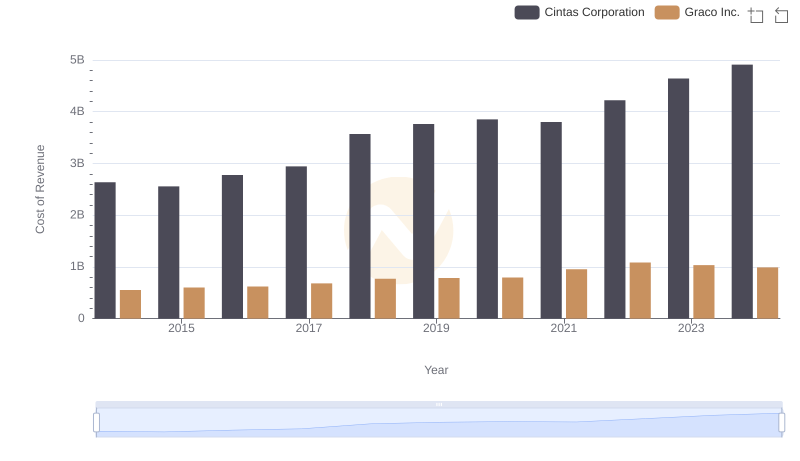
Analyzing Cost of Revenue: Cintas Corporation and Graco Inc.
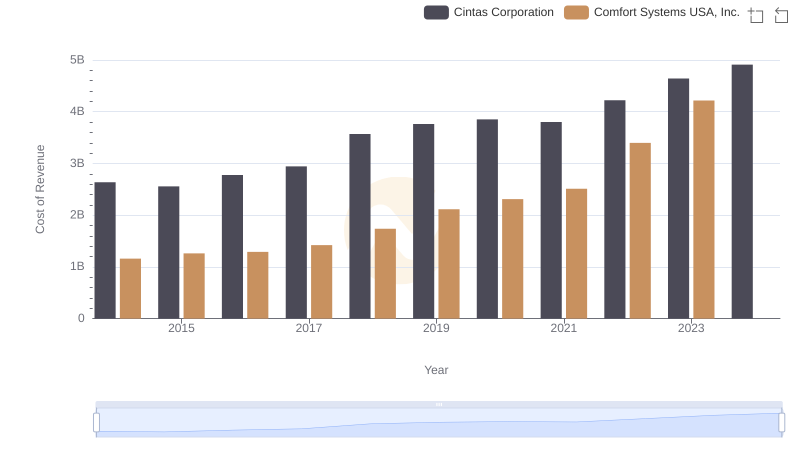
Cost of Revenue Comparison: Cintas Corporation vs Comfort Systems USA, Inc.
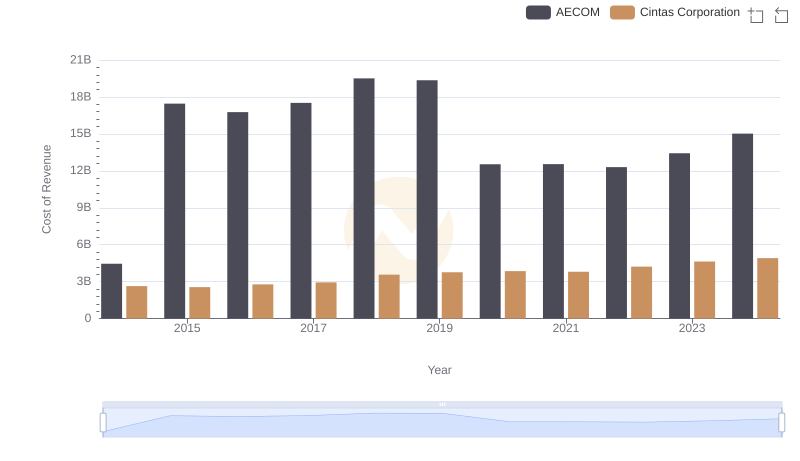
Cost Insights: Breaking Down Cintas Corporation and AECOM's Expenses
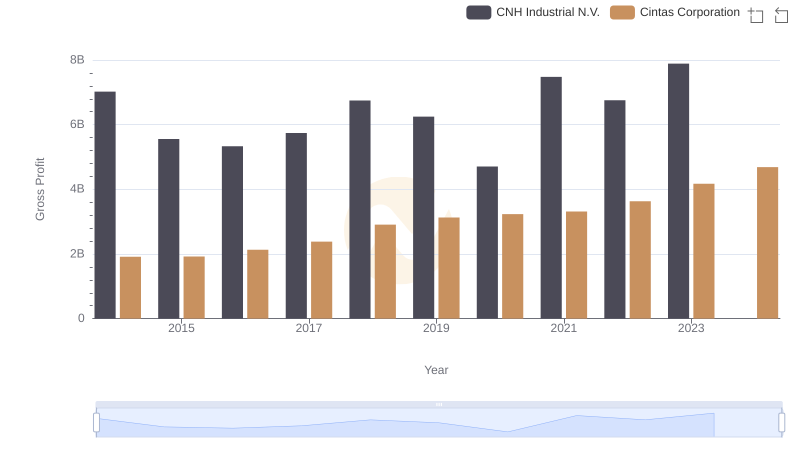
Who Generates Higher Gross Profit? Cintas Corporation or CNH Industrial N.V.
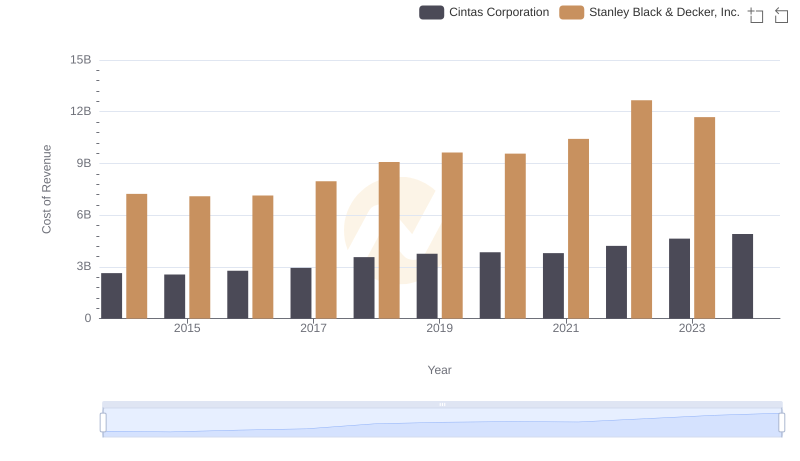
Analyzing Cost of Revenue: Cintas Corporation and Stanley Black & Decker, Inc.
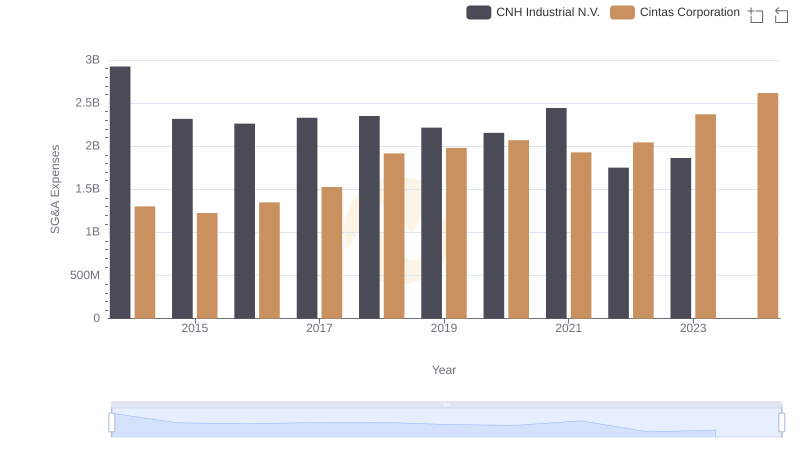
Cintas Corporation or CNH Industrial N.V.: Who Manages SG&A Costs Better?
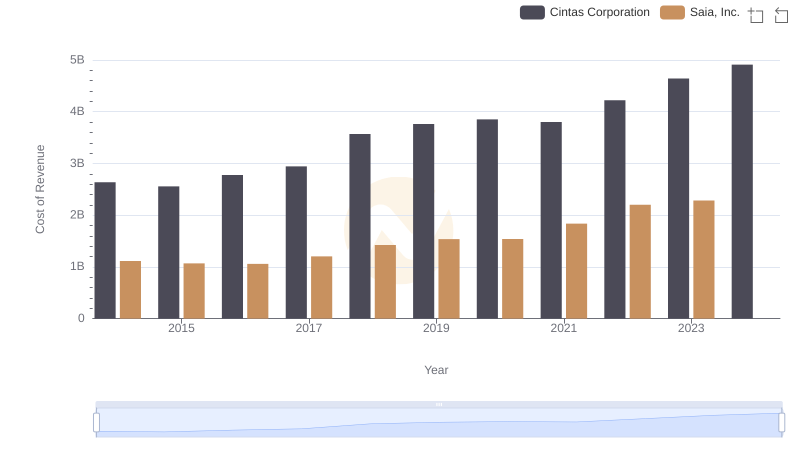
Cost of Revenue Trends: Cintas Corporation vs Saia, Inc.
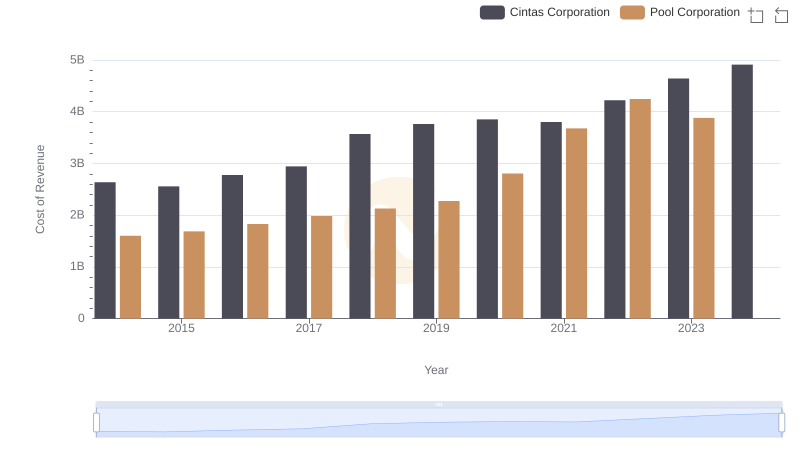
Cost of Revenue: Key Insights for Cintas Corporation and Pool Corporation