| __timestamp | Cintas Corporation | Saia, Inc. |
|---|---|---|
| Wednesday, January 1, 2014 | 2637426000 | 1113053000 |
| Thursday, January 1, 2015 | 2555549000 | 1067191000 |
| Friday, January 1, 2016 | 2775588000 | 1058979000 |
| Sunday, January 1, 2017 | 2943086000 | 1203464000 |
| Monday, January 1, 2018 | 3568109000 | 1423779000 |
| Tuesday, January 1, 2019 | 3763715000 | 1537082000 |
| Wednesday, January 1, 2020 | 3851372000 | 1538518000 |
| Friday, January 1, 2021 | 3801689000 | 1837017000 |
| Saturday, January 1, 2022 | 4222213000 | 2201094000 |
| Sunday, January 1, 2023 | 4642401000 | 2282501000 |
| Monday, January 1, 2024 | 4910199000 |
Data in motion
In the competitive landscape of the U.S. stock market, understanding cost efficiency is crucial. Cintas Corporation and Saia, Inc. have shown distinct trends in their cost of revenue from 2014 to 2023. Cintas Corporation, a leader in corporate identity uniforms, has seen a steady increase in its cost of revenue, rising approximately 86% over the decade. This growth reflects its expanding operations and market reach. In contrast, Saia, Inc., a prominent player in the freight transportation sector, experienced a 105% increase in cost of revenue, indicating its aggressive expansion and adaptation to market demands. Notably, data for 2024 is missing for Saia, Inc., suggesting a need for further analysis. These trends highlight the dynamic nature of cost management strategies in different industries, offering valuable insights for investors and analysts alike.
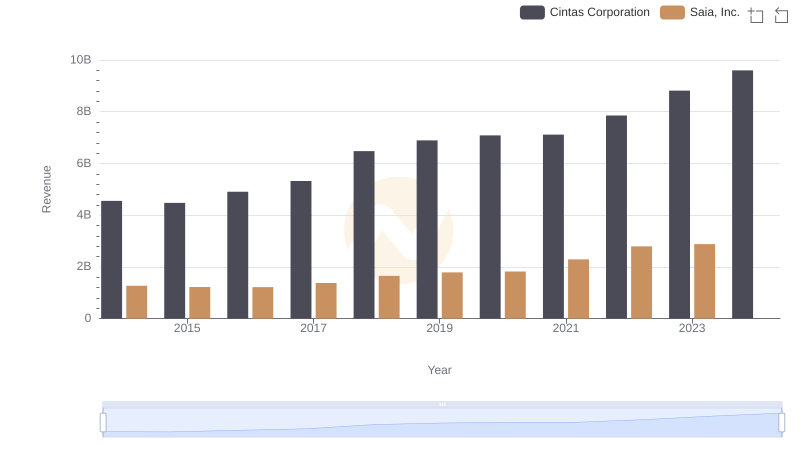
Cintas Corporation vs Saia, Inc.: Examining Key Revenue Metrics
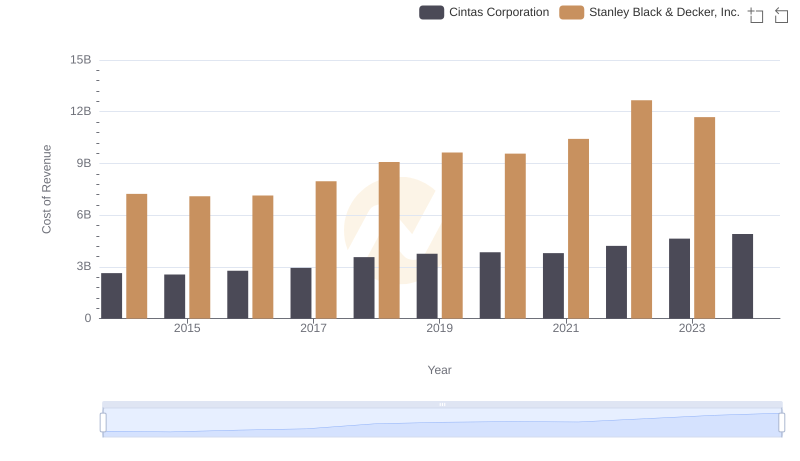
Analyzing Cost of Revenue: Cintas Corporation and Stanley Black & Decker, Inc.
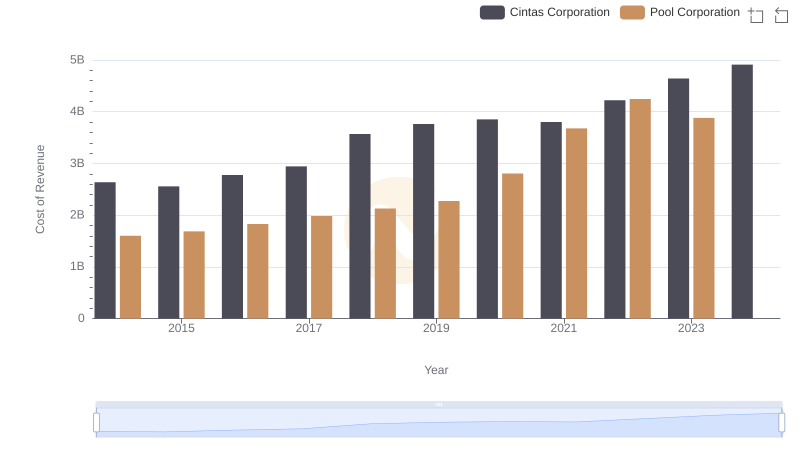
Cost of Revenue: Key Insights for Cintas Corporation and Pool Corporation
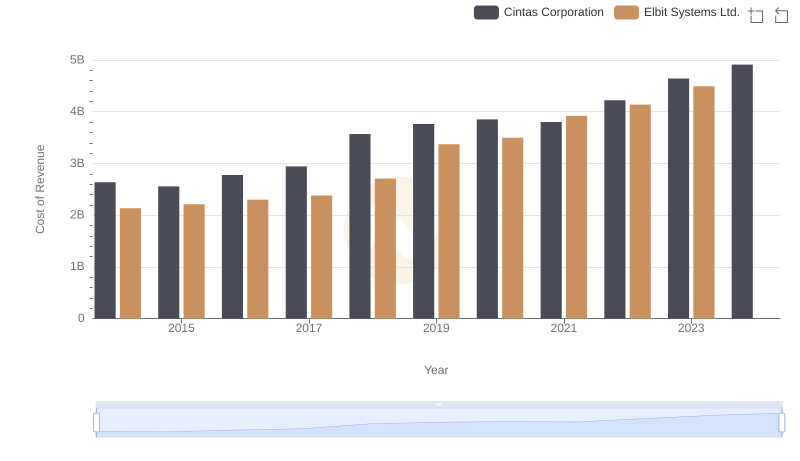
Analyzing Cost of Revenue: Cintas Corporation and Elbit Systems Ltd.
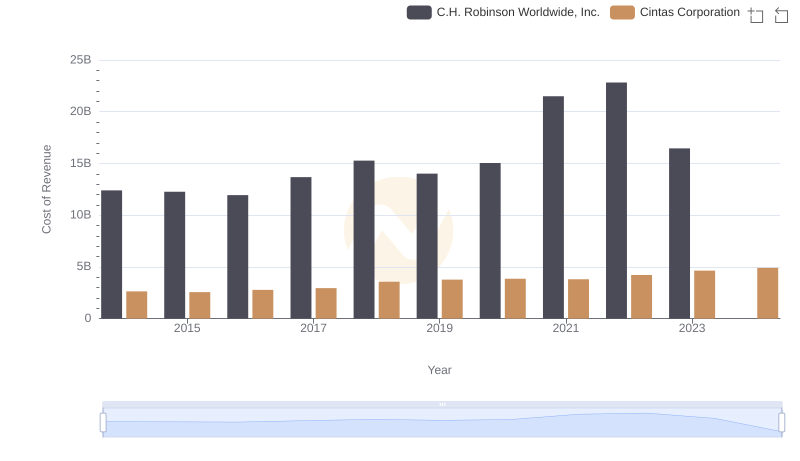
Cost of Revenue Trends: Cintas Corporation vs C.H. Robinson Worldwide, Inc.
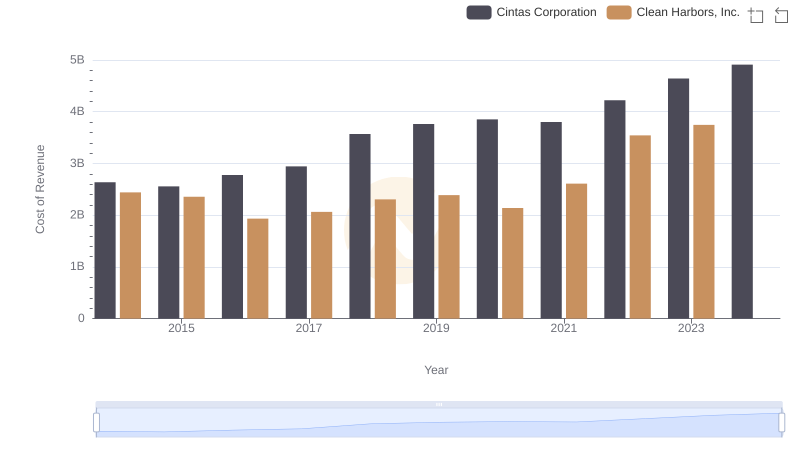
Analyzing Cost of Revenue: Cintas Corporation and Clean Harbors, Inc.
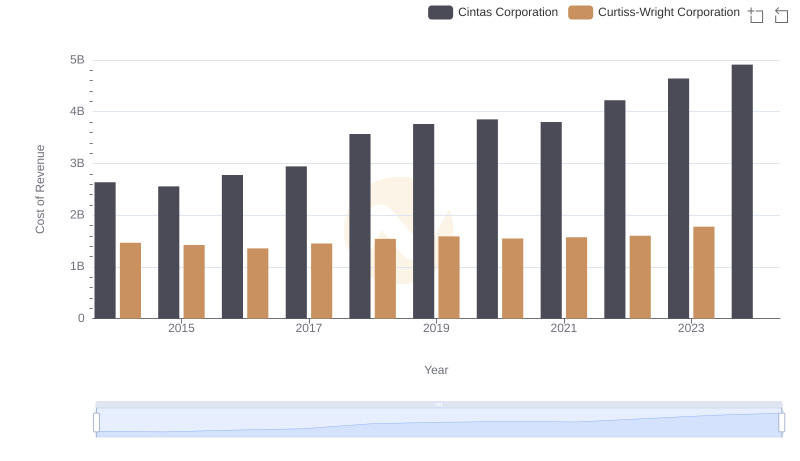
Cost of Revenue Comparison: Cintas Corporation vs Curtiss-Wright Corporation
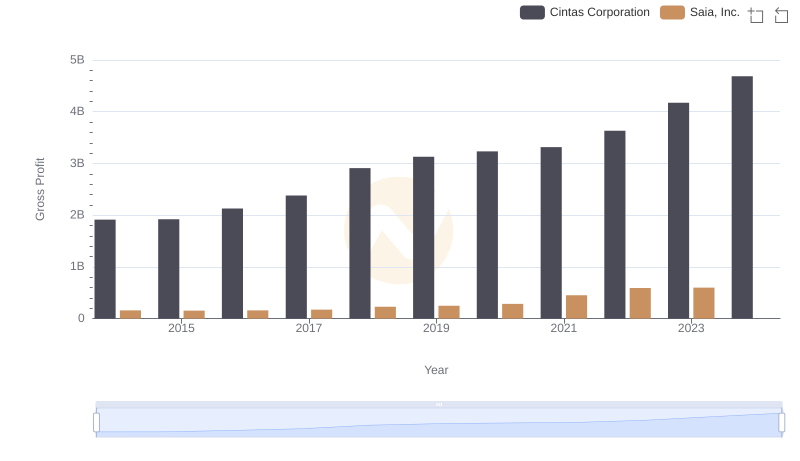
Who Generates Higher Gross Profit? Cintas Corporation or Saia, Inc.
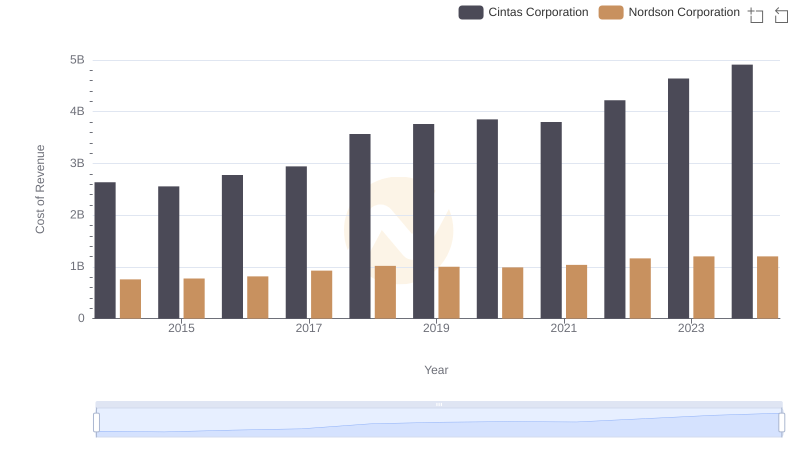
Comparing Cost of Revenue Efficiency: Cintas Corporation vs Nordson Corporation
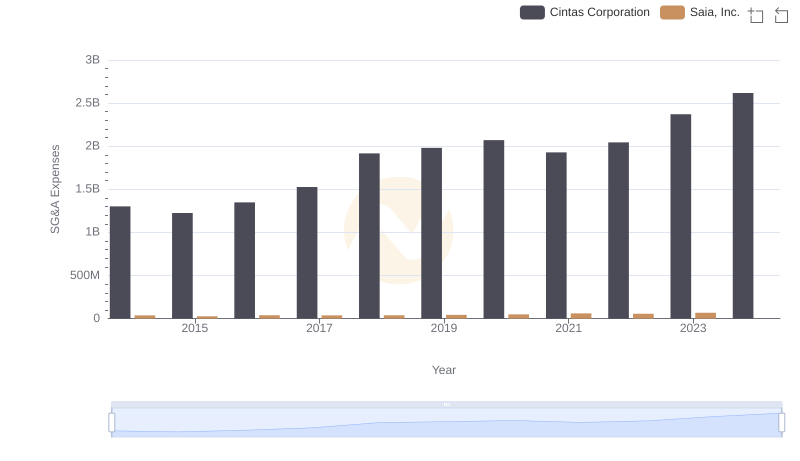
Selling, General, and Administrative Costs: Cintas Corporation vs Saia, Inc.
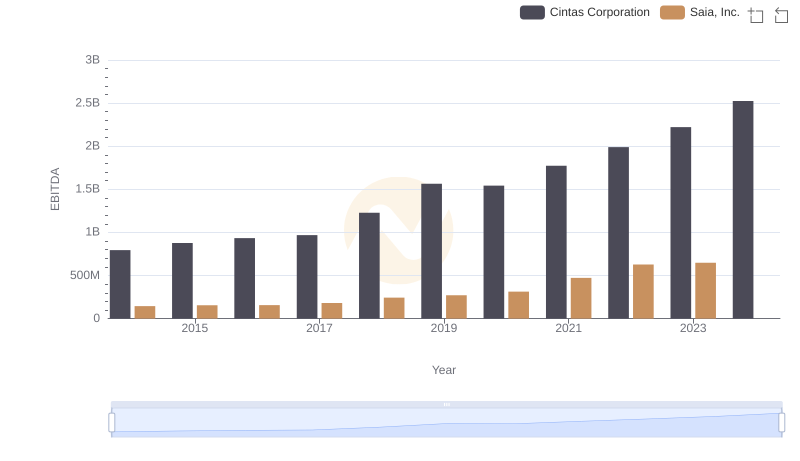
Cintas Corporation and Saia, Inc.: A Detailed Examination of EBITDA Performance