| __timestamp | AECOM | Cintas Corporation |
|---|---|---|
| Wednesday, January 1, 2014 | 417662000 | 793811000 |
| Thursday, January 1, 2015 | 1020478000 | 877761000 |
| Friday, January 1, 2016 | 926466000 | 933728000 |
| Sunday, January 1, 2017 | 920292000 | 968293000 |
| Monday, January 1, 2018 | 680801000 | 1227852000 |
| Tuesday, January 1, 2019 | 573352000 | 1564228000 |
| Wednesday, January 1, 2020 | 580017000 | 1542737000 |
| Friday, January 1, 2021 | 813356000 | 1773591000 |
| Saturday, January 1, 2022 | 826856000 | 1990046000 |
| Sunday, January 1, 2023 | 543642000 | 2221676000 |
| Monday, January 1, 2024 | 1082384000 | 2523857000 |
In pursuit of knowledge
In the competitive landscape of corporate finance, EBITDA serves as a crucial metric for evaluating a company's operational performance. Over the past decade, Cintas Corporation and AECOM have demonstrated contrasting trajectories in their EBITDA growth. From 2014 to 2024, Cintas Corporation's EBITDA surged by approximately 218%, reflecting its robust business model and strategic market positioning. In contrast, AECOM's EBITDA exhibited a more modest growth of around 159% during the same period, highlighting different operational challenges and market dynamics.
This analysis underscores the importance of strategic planning and market adaptability in achieving financial success.
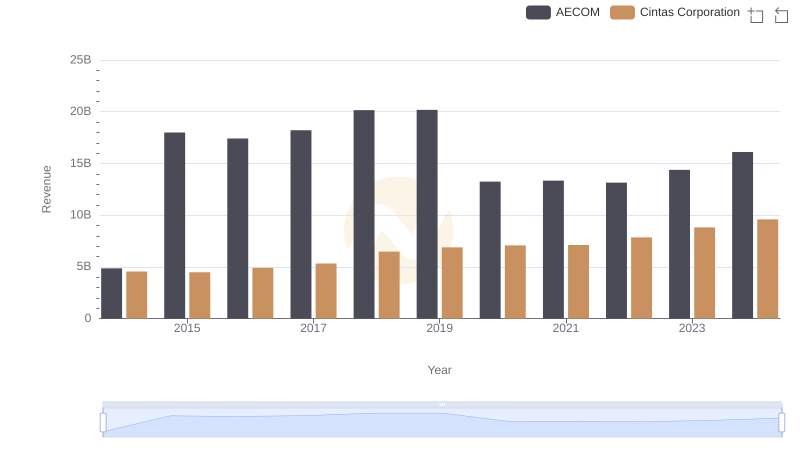
Breaking Down Revenue Trends: Cintas Corporation vs AECOM
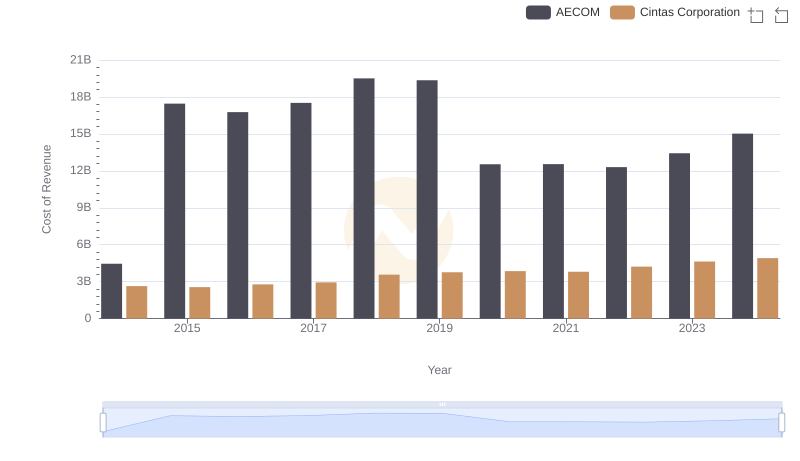
Cost Insights: Breaking Down Cintas Corporation and AECOM's Expenses
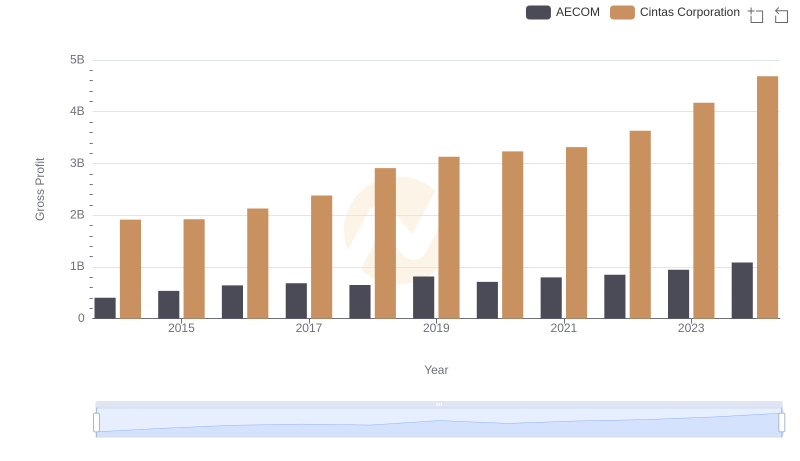
Gross Profit Trends Compared: Cintas Corporation vs AECOM
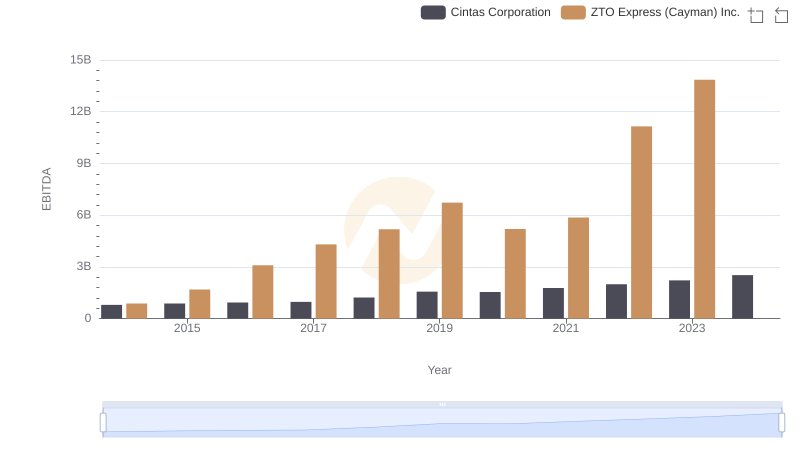
A Side-by-Side Analysis of EBITDA: Cintas Corporation and ZTO Express (Cayman) Inc.
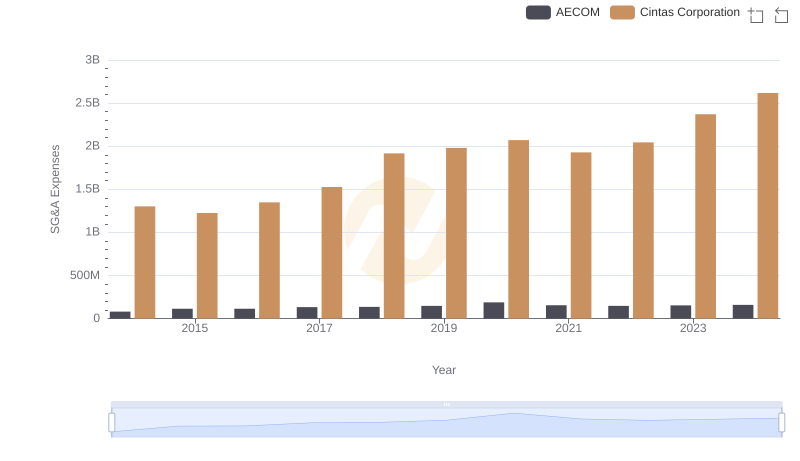
SG&A Efficiency Analysis: Comparing Cintas Corporation and AECOM
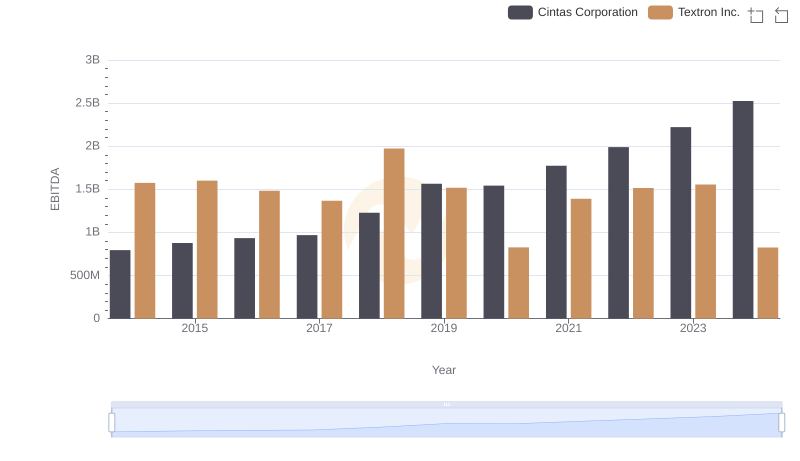
Comparative EBITDA Analysis: Cintas Corporation vs Textron Inc.

A Side-by-Side Analysis of EBITDA: Cintas Corporation and Avery Dennison Corporation
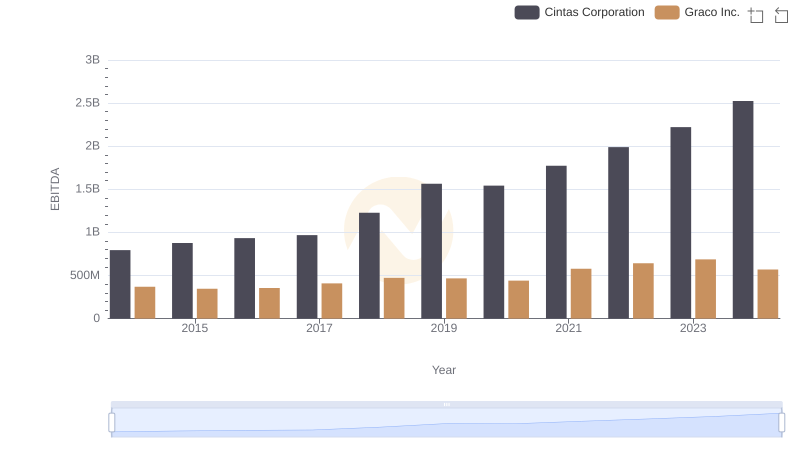
Comprehensive EBITDA Comparison: Cintas Corporation vs Graco Inc.
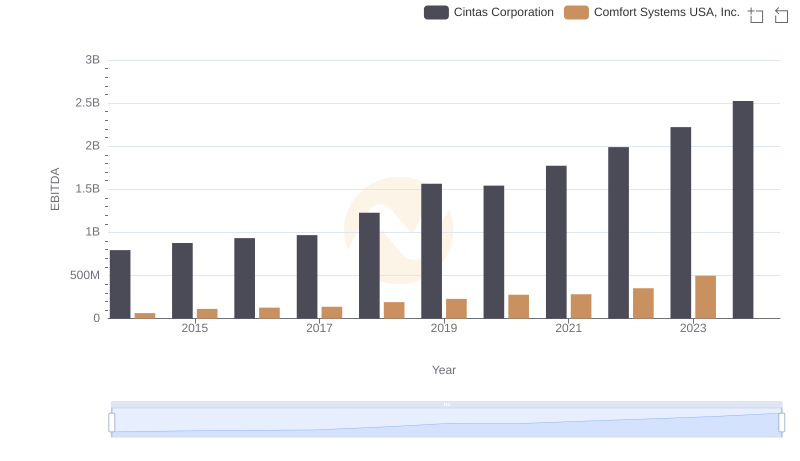
EBITDA Performance Review: Cintas Corporation vs Comfort Systems USA, Inc.
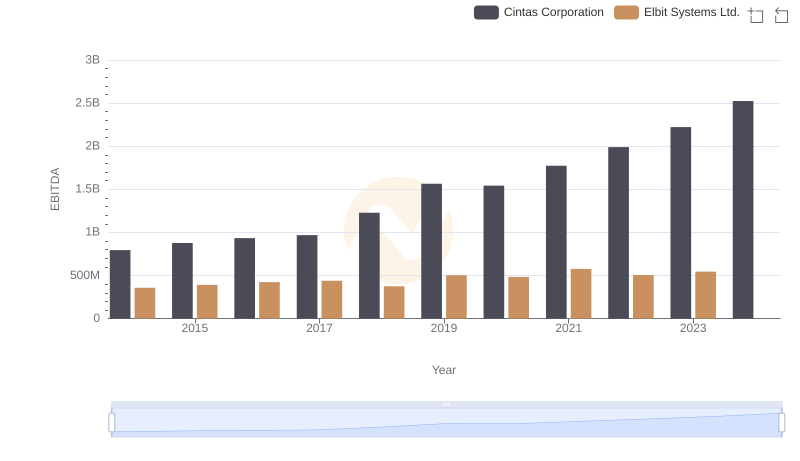
Comprehensive EBITDA Comparison: Cintas Corporation vs Elbit Systems Ltd.
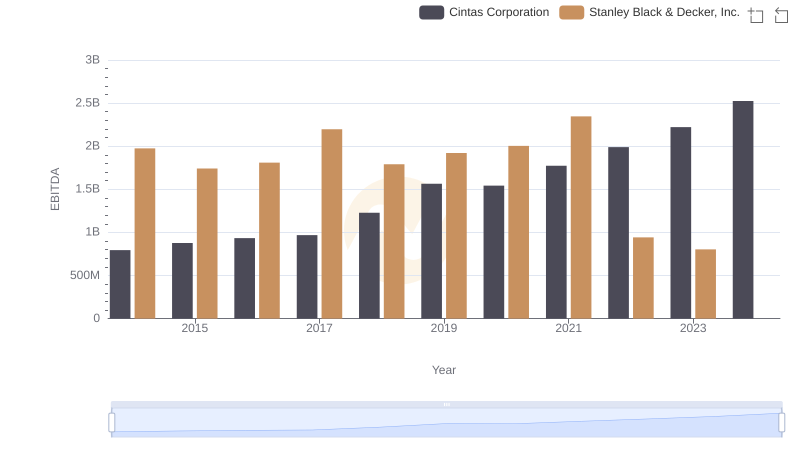
Comprehensive EBITDA Comparison: Cintas Corporation vs Stanley Black & Decker, Inc.