| __timestamp | Cintas Corporation | Graco Inc. |
|---|---|---|
| Wednesday, January 1, 2014 | 2637426000 | 554394000 |
| Thursday, January 1, 2015 | 2555549000 | 601785000 |
| Friday, January 1, 2016 | 2775588000 | 621054000 |
| Sunday, January 1, 2017 | 2943086000 | 681695000 |
| Monday, January 1, 2018 | 3568109000 | 770753000 |
| Tuesday, January 1, 2019 | 3763715000 | 786289000 |
| Wednesday, January 1, 2020 | 3851372000 | 795178000 |
| Friday, January 1, 2021 | 3801689000 | 953659000 |
| Saturday, January 1, 2022 | 4222213000 | 1086082000 |
| Sunday, January 1, 2023 | 4642401000 | 1034585000 |
| Monday, January 1, 2024 | 4910199000 | 990855000 |
Cracking the code
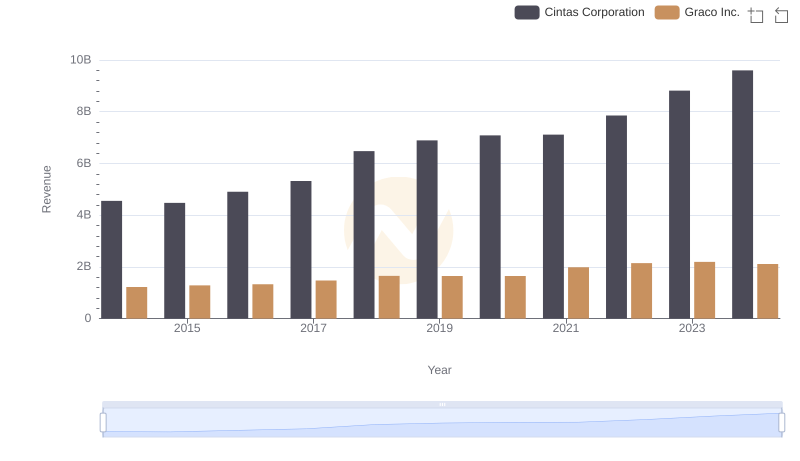
In the competitive landscape of industrial services and manufacturing, understanding cost efficiency is crucial. Cintas Corporation and Graco Inc., two giants in their respective fields, have shown distinct trends in their cost of revenue over the past decade.
From 2014 to 2024, Cintas Corporation's cost of revenue has seen a consistent upward trajectory, increasing by approximately 86%. This growth reflects the company's expanding operations and market reach. Notably, the cost of revenue surged by 15% from 2022 to 2024, indicating strategic investments or scaling efforts.
Graco Inc., on the other hand, experienced a more modest increase of around 79% over the same period. The company's cost of revenue peaked in 2022, with a slight decline in 2023 and 2024, suggesting potential efficiency improvements or shifts in operational strategy.
These insights into cost management strategies provide valuable lessons for businesses aiming to optimize their financial performance.
Cintas Corporation and Graco Inc.: A Comprehensive Revenue Analysis
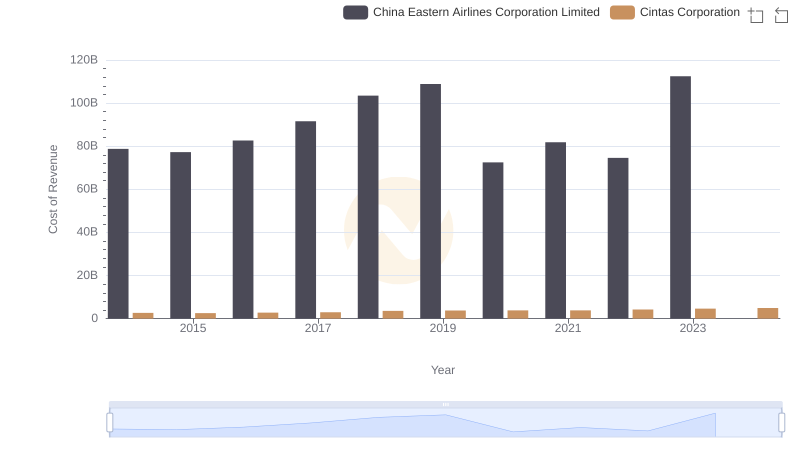
Analyzing Cost of Revenue: Cintas Corporation and China Eastern Airlines Corporation Limited
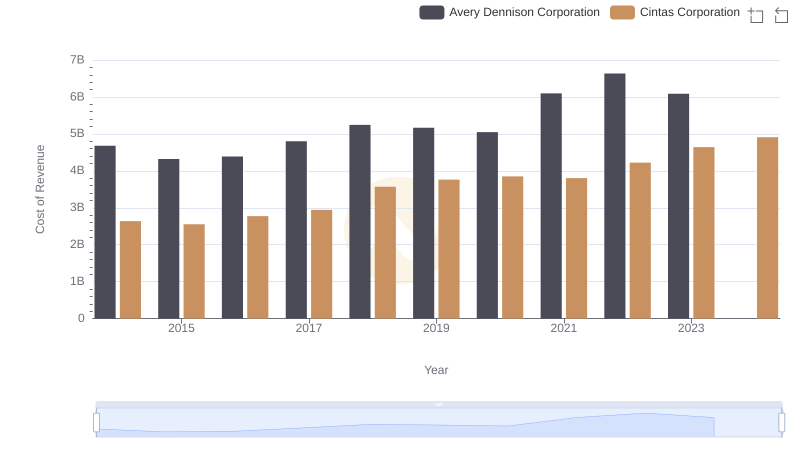
Cost of Revenue: Key Insights for Cintas Corporation and Avery Dennison Corporation
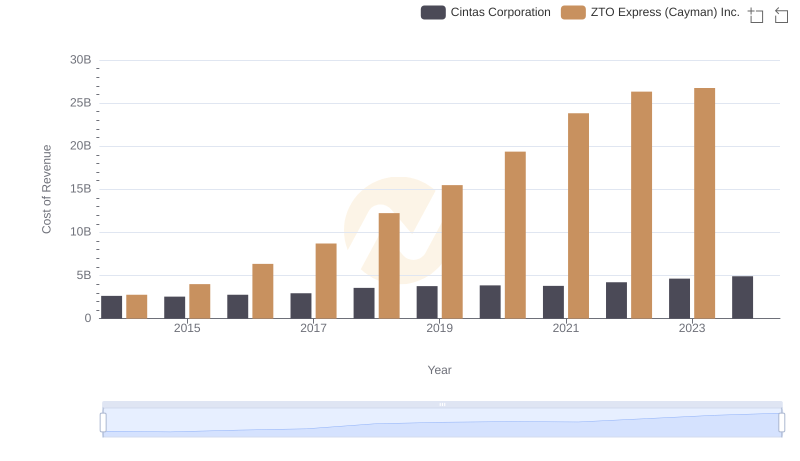
Cost of Revenue Trends: Cintas Corporation vs ZTO Express (Cayman) Inc.
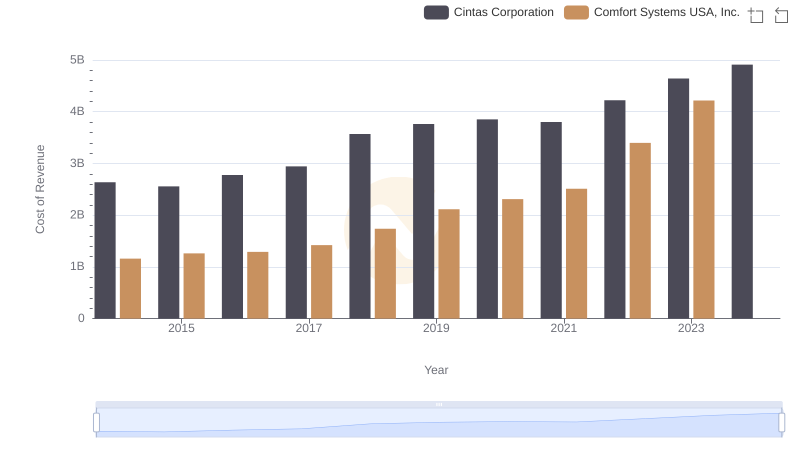
Cost of Revenue Comparison: Cintas Corporation vs Comfort Systems USA, Inc.
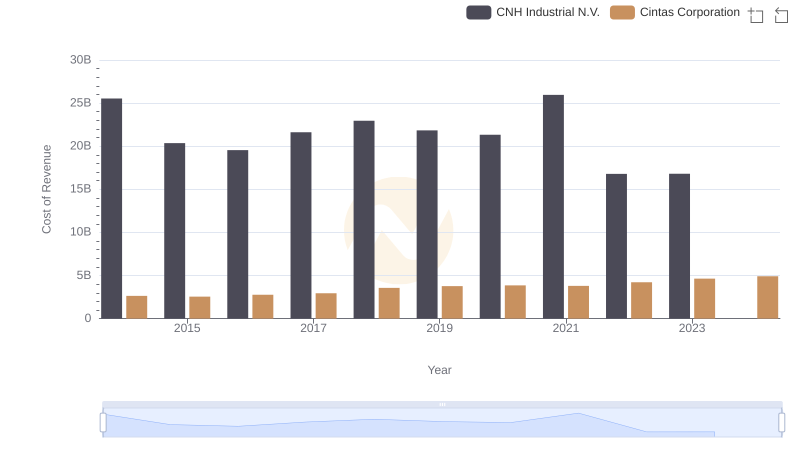
Cost of Revenue: Key Insights for Cintas Corporation and CNH Industrial N.V.
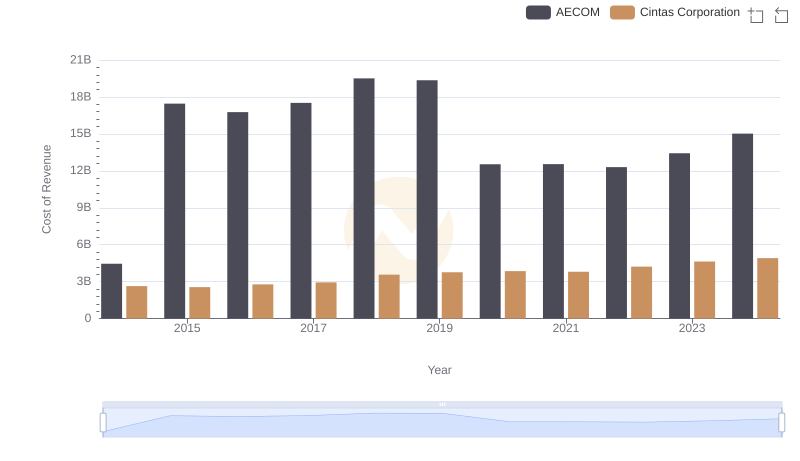
Cost Insights: Breaking Down Cintas Corporation and AECOM's Expenses

Gross Profit Analysis: Comparing Cintas Corporation and Graco Inc.
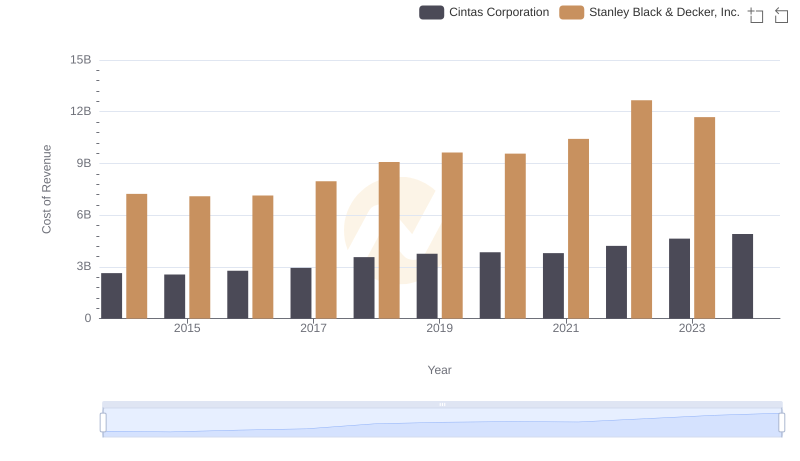
Analyzing Cost of Revenue: Cintas Corporation and Stanley Black & Decker, Inc.
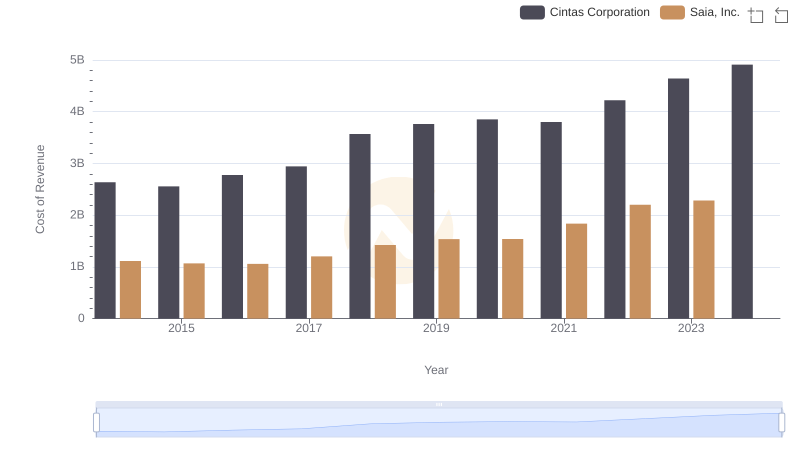
Cost of Revenue Trends: Cintas Corporation vs Saia, Inc.

Comparing SG&A Expenses: Cintas Corporation vs Graco Inc. Trends and Insights
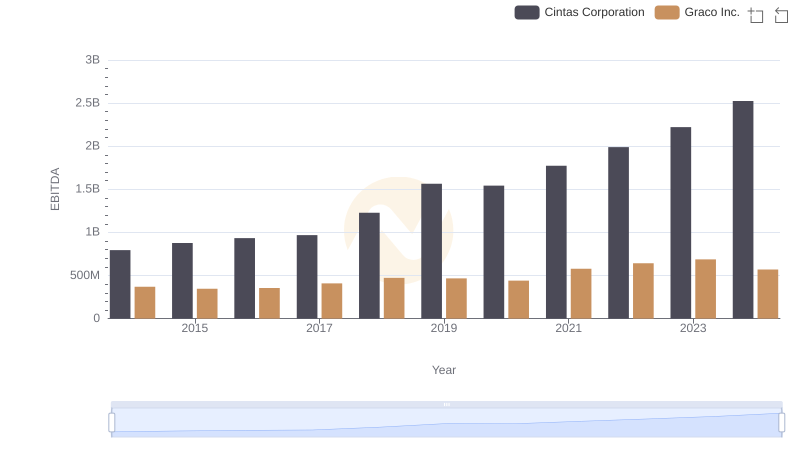
Comprehensive EBITDA Comparison: Cintas Corporation vs Graco Inc.