| __timestamp | Cintas Corporation | Pool Corporation |
|---|---|---|
| Wednesday, January 1, 2014 | 2637426000 | 1603222000 |
| Thursday, January 1, 2015 | 2555549000 | 1687495000 |
| Friday, January 1, 2016 | 2775588000 | 1829716000 |
| Sunday, January 1, 2017 | 2943086000 | 1982899000 |
| Monday, January 1, 2018 | 3568109000 | 2127924000 |
| Tuesday, January 1, 2019 | 3763715000 | 2274592000 |
| Wednesday, January 1, 2020 | 3851372000 | 2805721000 |
| Friday, January 1, 2021 | 3801689000 | 3678492000 |
| Saturday, January 1, 2022 | 4222213000 | 4246315000 |
| Sunday, January 1, 2023 | 4642401000 | 3881551000 |
| Monday, January 1, 2024 | 4910199000 |
Unleashing the power of data
In the ever-evolving landscape of corporate finance, understanding cost structures is crucial. Cintas Corporation and Pool Corporation, two giants in their respective industries, have shown intriguing trends in their cost of revenue over the past decade. From 2014 to 2023, Cintas Corporation's cost of revenue surged by approximately 86%, reflecting its strategic expansions and operational efficiencies. In contrast, Pool Corporation experienced a 142% increase from 2014 to 2022, before a slight dip in 2023, possibly due to market adjustments or strategic shifts.
The data reveals that while both companies have grown, their cost management strategies differ significantly. Cintas consistently increased its cost of revenue, peaking in 2024, while Pool Corporation's costs plateaued in 2022. This divergence highlights the unique challenges and opportunities each company faces in their respective markets. Missing data for Pool Corporation in 2024 suggests potential reporting delays or strategic changes.
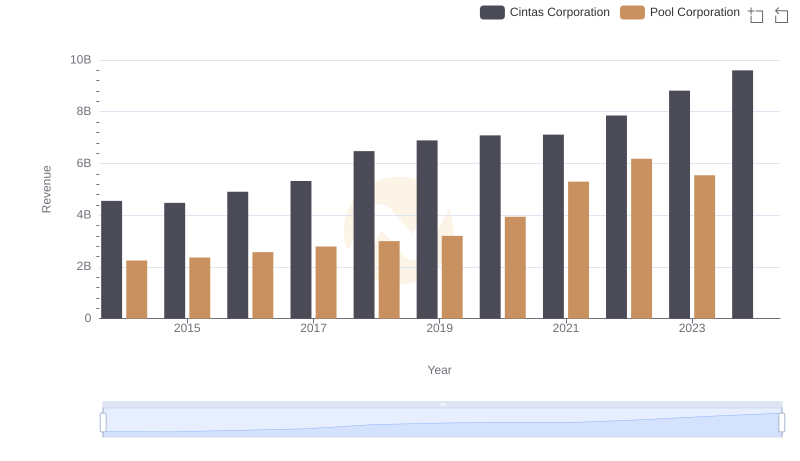
Who Generates More Revenue? Cintas Corporation or Pool Corporation
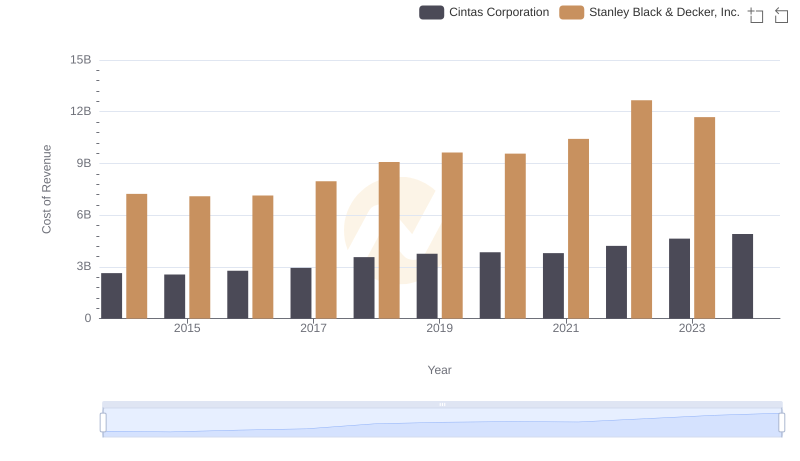
Analyzing Cost of Revenue: Cintas Corporation and Stanley Black & Decker, Inc.
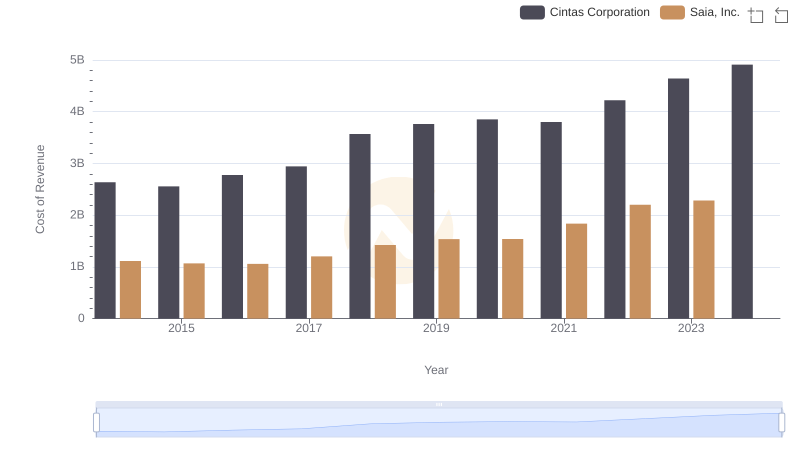
Cost of Revenue Trends: Cintas Corporation vs Saia, Inc.
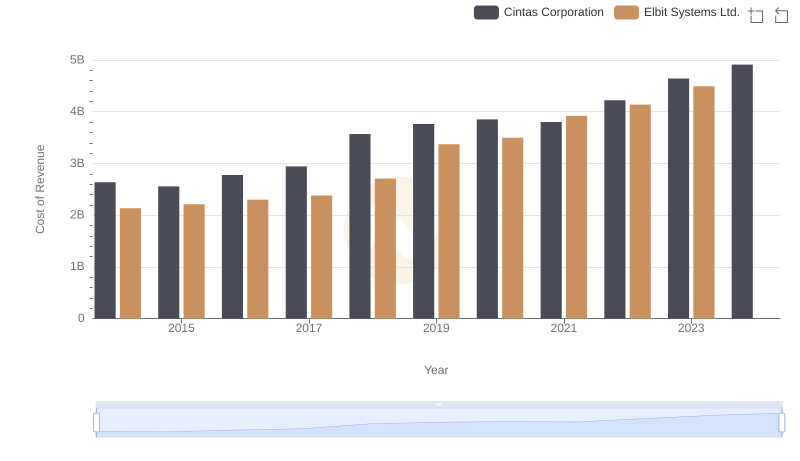
Analyzing Cost of Revenue: Cintas Corporation and Elbit Systems Ltd.
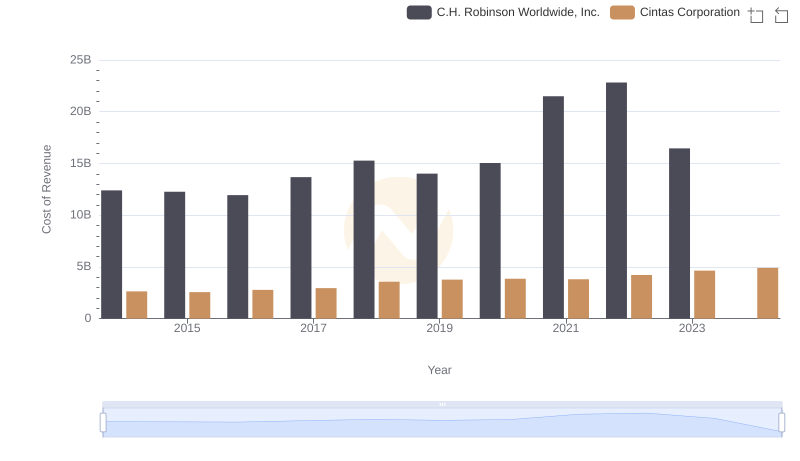
Cost of Revenue Trends: Cintas Corporation vs C.H. Robinson Worldwide, Inc.
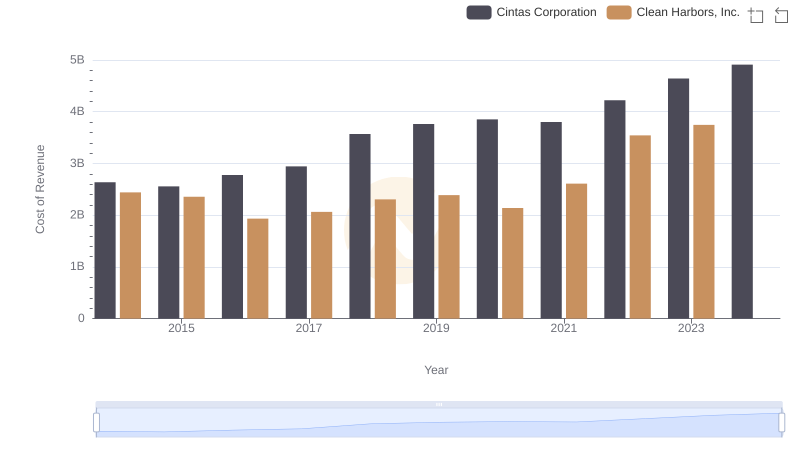
Analyzing Cost of Revenue: Cintas Corporation and Clean Harbors, Inc.
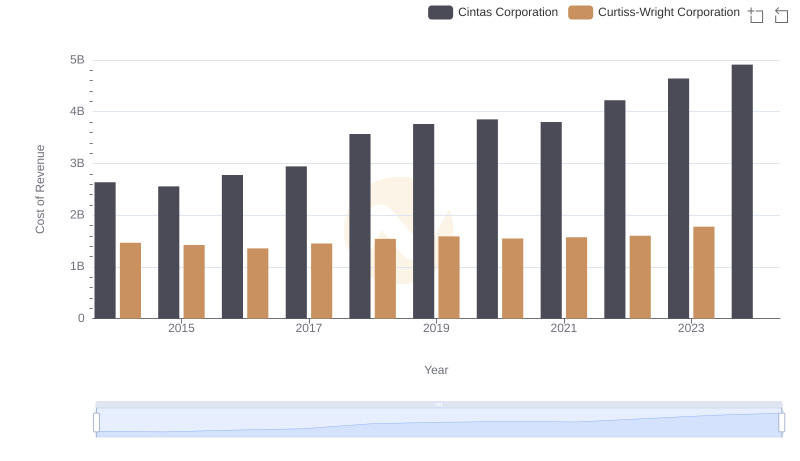
Cost of Revenue Comparison: Cintas Corporation vs Curtiss-Wright Corporation
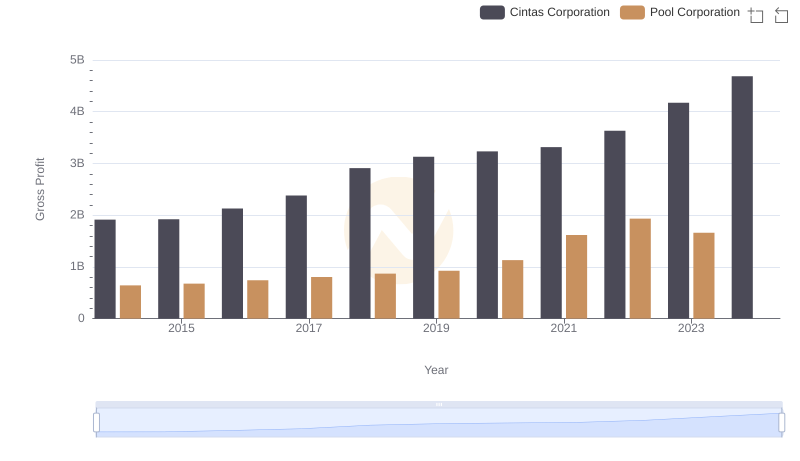
Who Generates Higher Gross Profit? Cintas Corporation or Pool Corporation
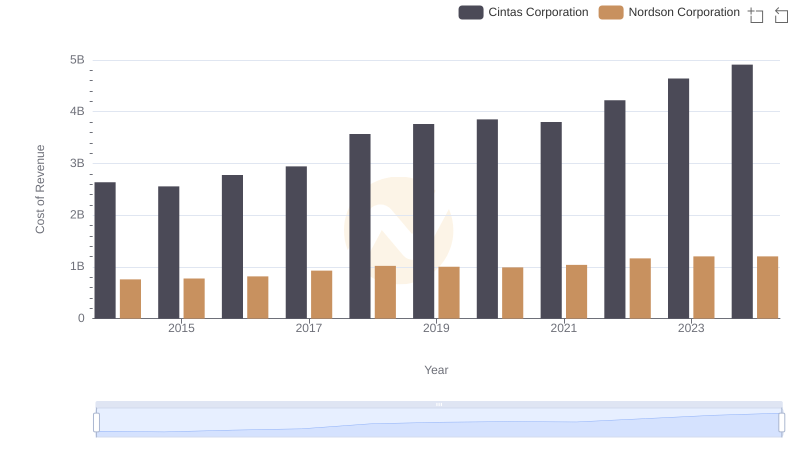
Comparing Cost of Revenue Efficiency: Cintas Corporation vs Nordson Corporation
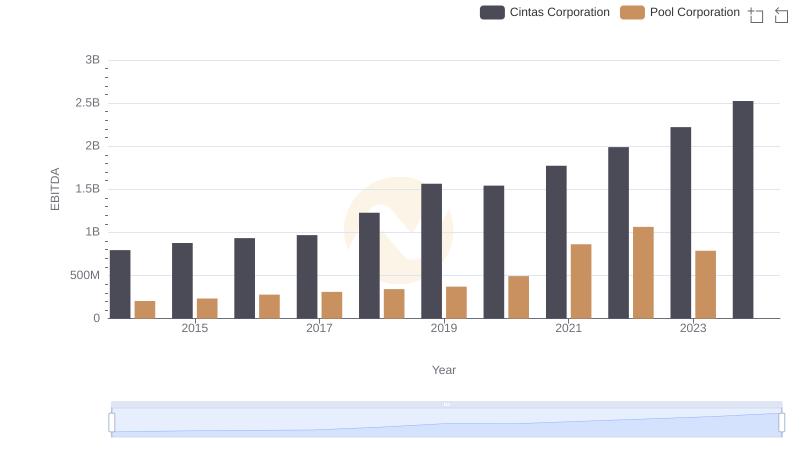
Comparative EBITDA Analysis: Cintas Corporation vs Pool Corporation