| __timestamp | Axon Enterprise, Inc. | TransUnion |
|---|---|---|
| Wednesday, January 1, 2014 | 62977000 | 499100000 |
| Thursday, January 1, 2015 | 69245000 | 531600000 |
| Friday, January 1, 2016 | 97709000 | 579100000 |
| Sunday, January 1, 2017 | 136710000 | 645700000 |
| Monday, January 1, 2018 | 161485000 | 790100000 |
| Tuesday, January 1, 2019 | 223574000 | 874100000 |
| Wednesday, January 1, 2020 | 264672000 | 920400000 |
| Friday, January 1, 2021 | 322471000 | 991600000 |
| Saturday, January 1, 2022 | 461297000 | 1222900000 |
| Sunday, January 1, 2023 | 608009000 | 1517300000 |
| Monday, January 1, 2024 | 0 |
Unleashing the power of data
In the evolving landscape of corporate finance, understanding cost structures is pivotal. Over the past decade, Axon Enterprise, Inc. and TransUnion have showcased intriguing trends in their cost of revenue. From 2014 to 2023, Axon Enterprise, Inc. saw a staggering 866% increase in costs, reflecting its aggressive growth and expansion strategies. Meanwhile, TransUnion's costs rose by approximately 204%, indicating steady growth in its data-driven services.
These insights provide a window into how these companies navigate their financial landscapes, offering valuable lessons for investors and industry analysts alike.
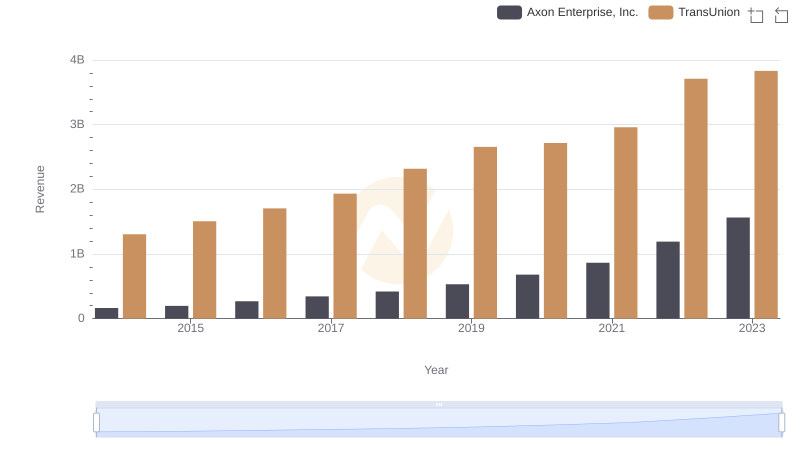
Breaking Down Revenue Trends: Axon Enterprise, Inc. vs TransUnion
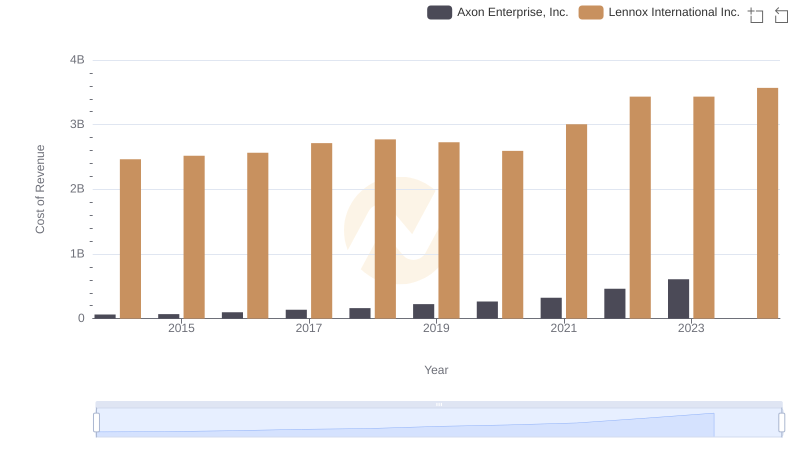
Cost of Revenue Trends: Axon Enterprise, Inc. vs Lennox International Inc.
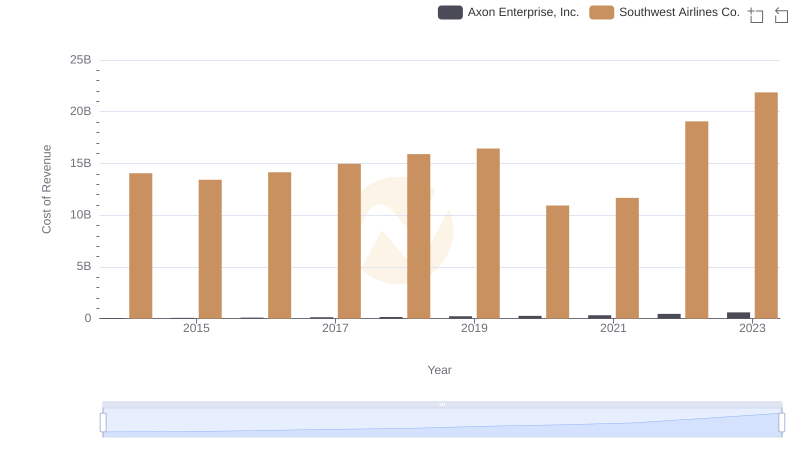
Cost of Revenue Trends: Axon Enterprise, Inc. vs Southwest Airlines Co.
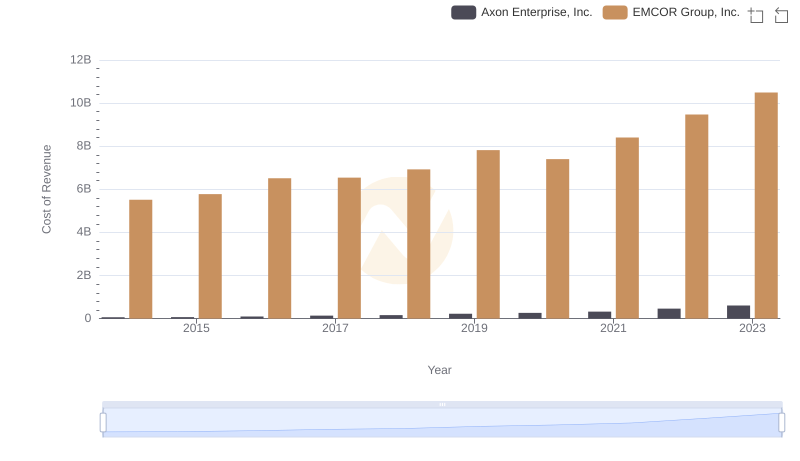
Cost of Revenue Comparison: Axon Enterprise, Inc. vs EMCOR Group, Inc.
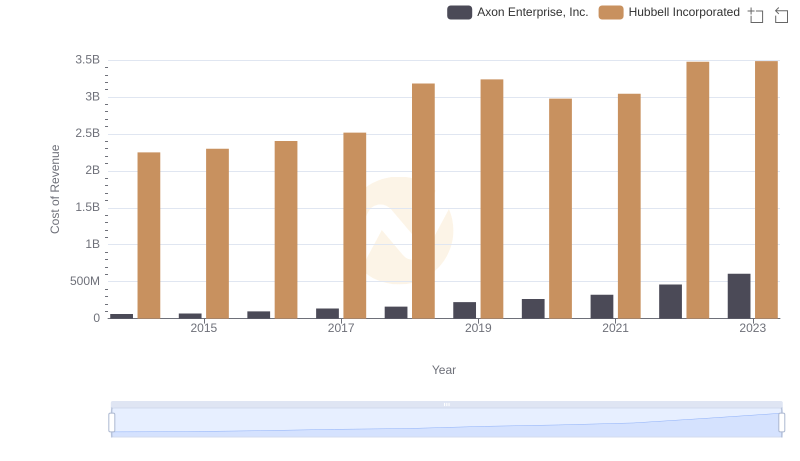
Analyzing Cost of Revenue: Axon Enterprise, Inc. and Hubbell Incorporated
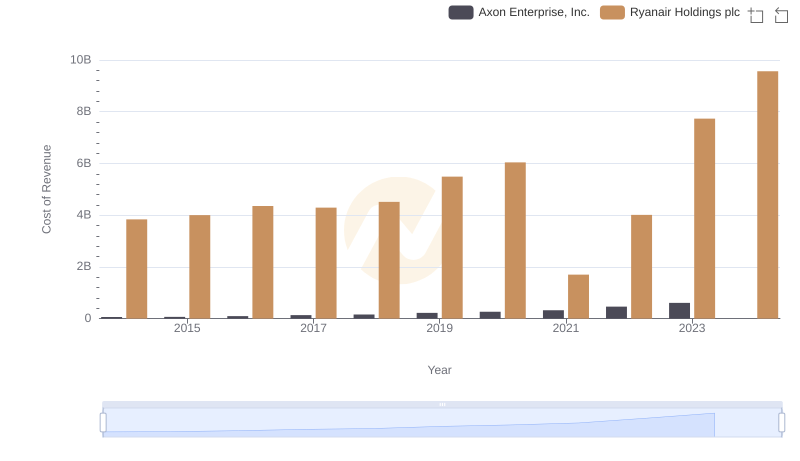
Comparing Cost of Revenue Efficiency: Axon Enterprise, Inc. vs Ryanair Holdings plc
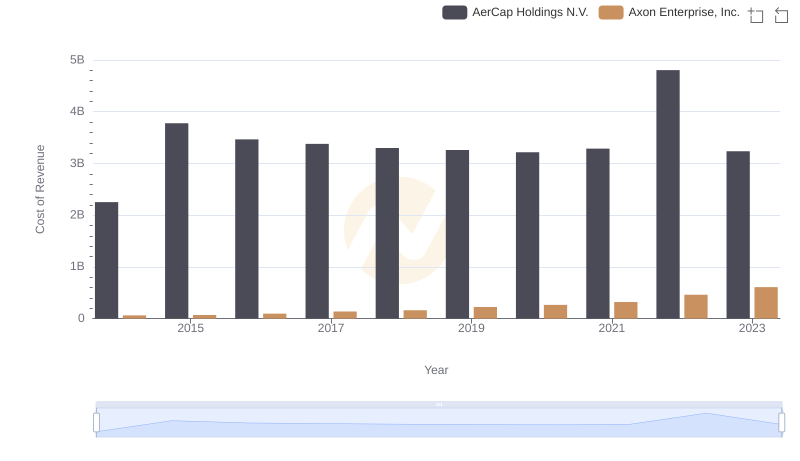
Cost of Revenue: Key Insights for Axon Enterprise, Inc. and AerCap Holdings N.V.
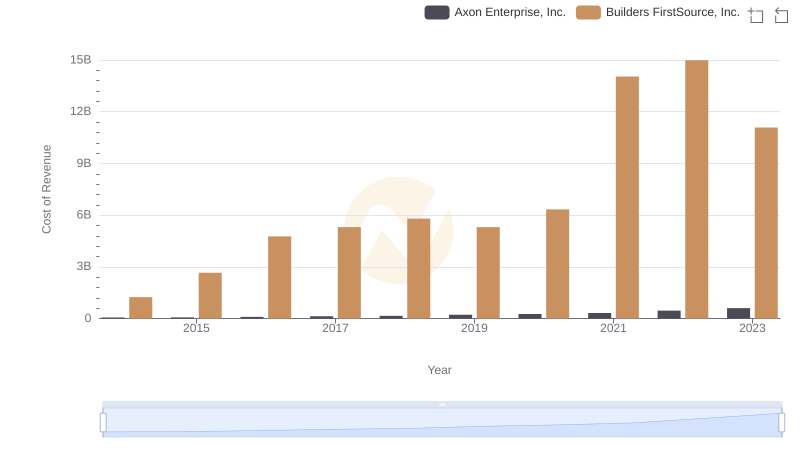
Axon Enterprise, Inc. vs Builders FirstSource, Inc.: Efficiency in Cost of Revenue Explored
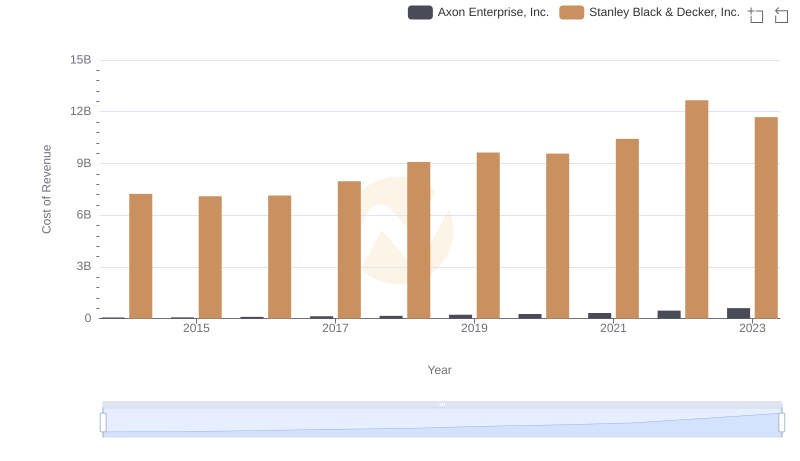
Cost of Revenue Trends: Axon Enterprise, Inc. vs Stanley Black & Decker, Inc.

Cost of Revenue: Key Insights for Axon Enterprise, Inc. and Snap-on Incorporated
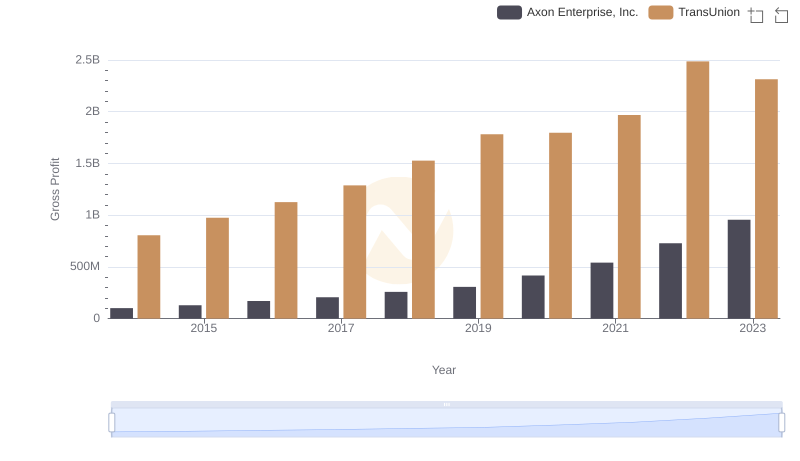
Gross Profit Comparison: Axon Enterprise, Inc. and TransUnion Trends
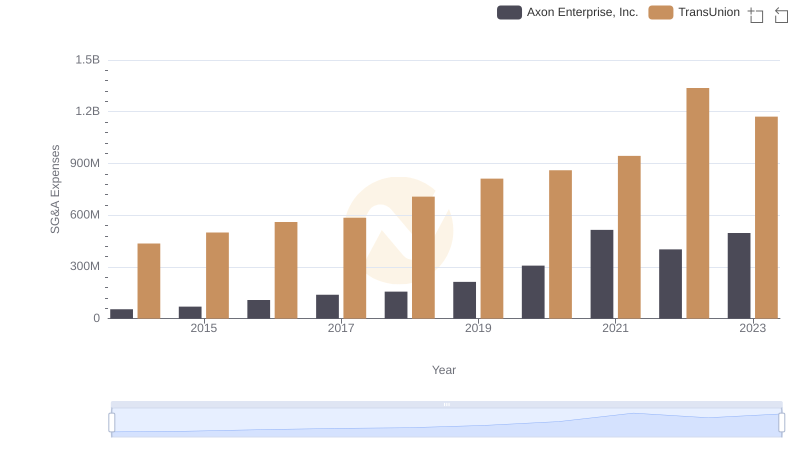
Selling, General, and Administrative Costs: Axon Enterprise, Inc. vs TransUnion