| __timestamp | Axon Enterprise, Inc. | EMCOR Group, Inc. |
|---|---|---|
| Wednesday, January 1, 2014 | 62977000 | 5517719000 |
| Thursday, January 1, 2015 | 69245000 | 5774247000 |
| Friday, January 1, 2016 | 97709000 | 6513662000 |
| Sunday, January 1, 2017 | 136710000 | 6539987000 |
| Monday, January 1, 2018 | 161485000 | 6925178000 |
| Tuesday, January 1, 2019 | 223574000 | 7818743000 |
| Wednesday, January 1, 2020 | 264672000 | 7401679000 |
| Friday, January 1, 2021 | 322471000 | 8401843000 |
| Saturday, January 1, 2022 | 461297000 | 9472526000 |
| Sunday, January 1, 2023 | 608009000 | 10493534000 |
Data in motion
In the ever-evolving landscape of American industry, Axon Enterprise, Inc. and EMCOR Group, Inc. stand as intriguing case studies in cost management. Over the past decade, from 2014 to 2023, these companies have demonstrated contrasting trajectories in their cost of revenue.
Axon, known for its innovative public safety technologies, has seen its cost of revenue grow nearly tenfold, from approximately $63 million in 2014 to over $600 million in 2023. This reflects a robust expansion strategy, with a compound annual growth rate (CAGR) of around 30%.
Conversely, EMCOR, a leader in mechanical and electrical construction services, has maintained a more stable growth pattern. Its cost of revenue increased by about 90% over the same period, reaching over $10 billion in 2023. This steady rise underscores EMCOR's consistent market presence and operational efficiency.
These insights reveal the diverse strategies and market dynamics shaping these two industry giants.
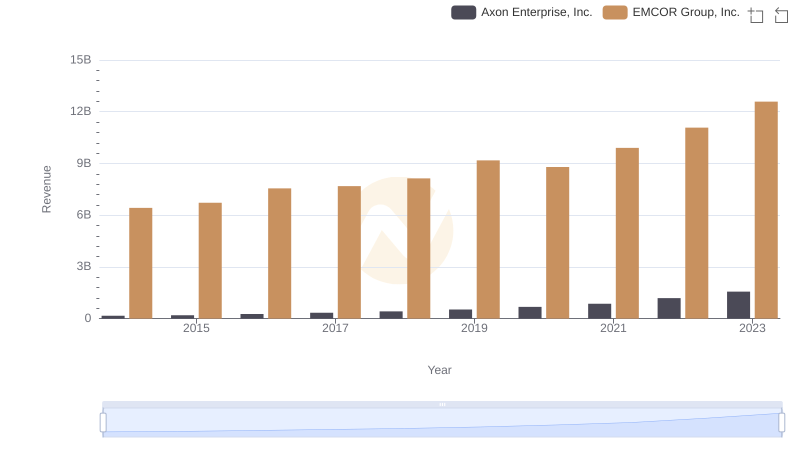
Comparing Revenue Performance: Axon Enterprise, Inc. or EMCOR Group, Inc.?
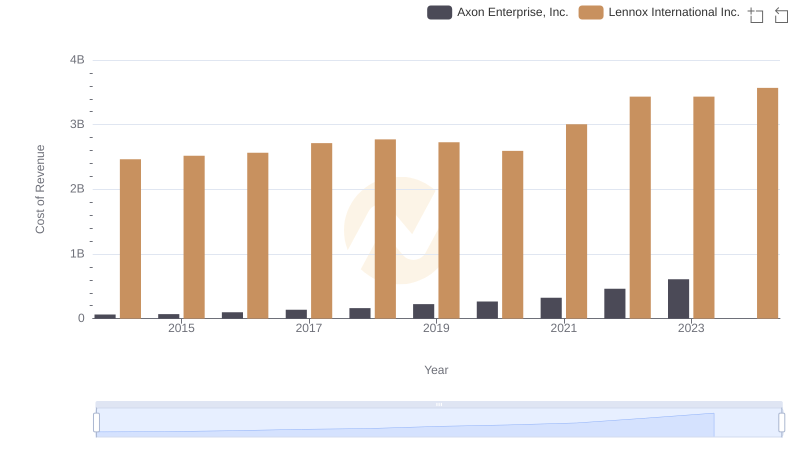
Cost of Revenue Trends: Axon Enterprise, Inc. vs Lennox International Inc.
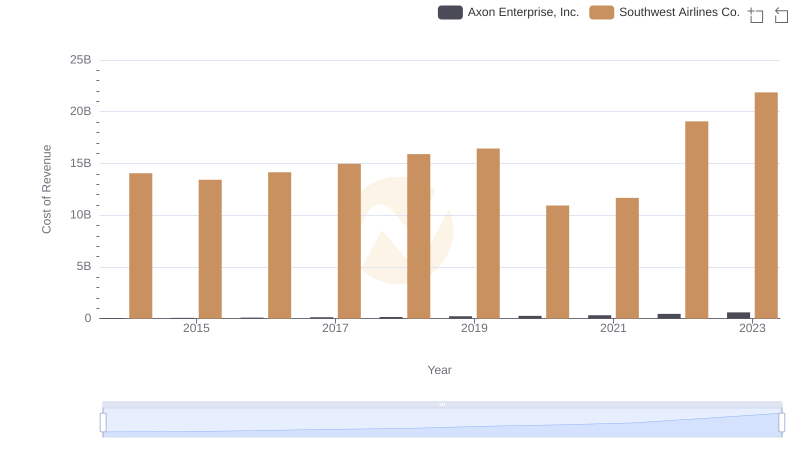
Cost of Revenue Trends: Axon Enterprise, Inc. vs Southwest Airlines Co.
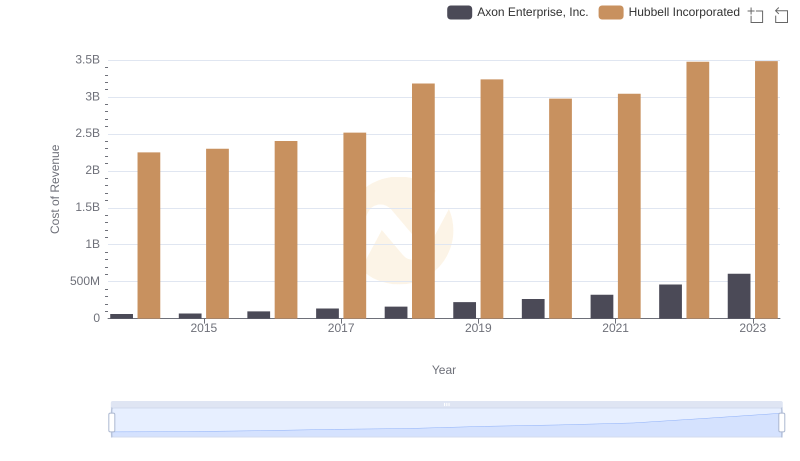
Analyzing Cost of Revenue: Axon Enterprise, Inc. and Hubbell Incorporated
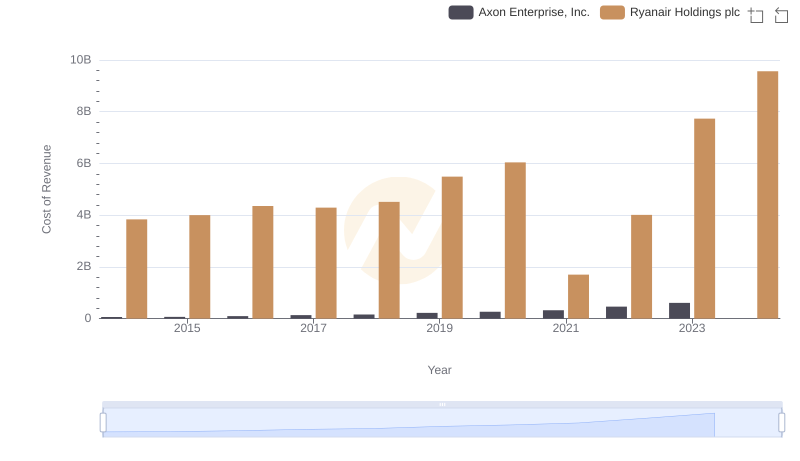
Comparing Cost of Revenue Efficiency: Axon Enterprise, Inc. vs Ryanair Holdings plc
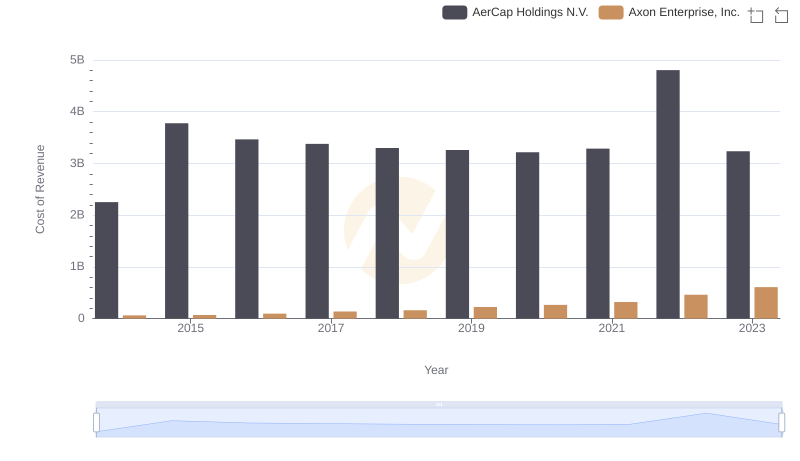
Cost of Revenue: Key Insights for Axon Enterprise, Inc. and AerCap Holdings N.V.
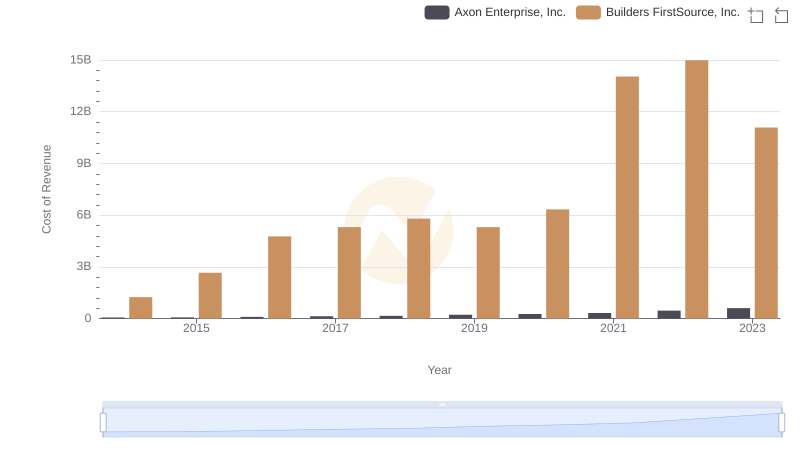
Axon Enterprise, Inc. vs Builders FirstSource, Inc.: Efficiency in Cost of Revenue Explored
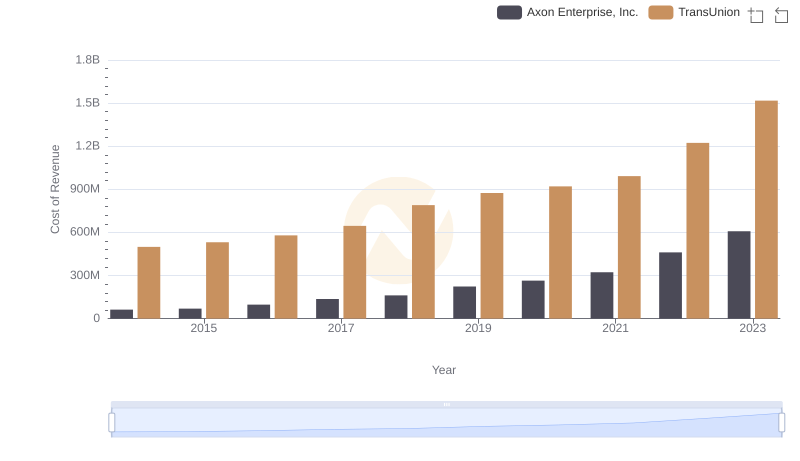
Cost Insights: Breaking Down Axon Enterprise, Inc. and TransUnion's Expenses
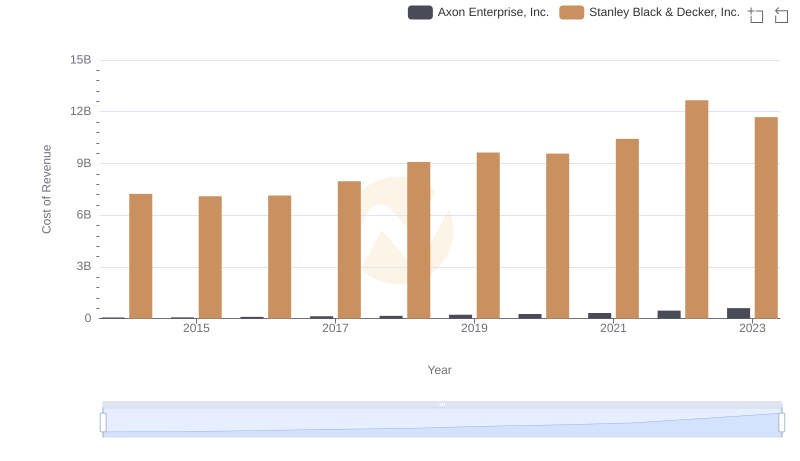
Cost of Revenue Trends: Axon Enterprise, Inc. vs Stanley Black & Decker, Inc.
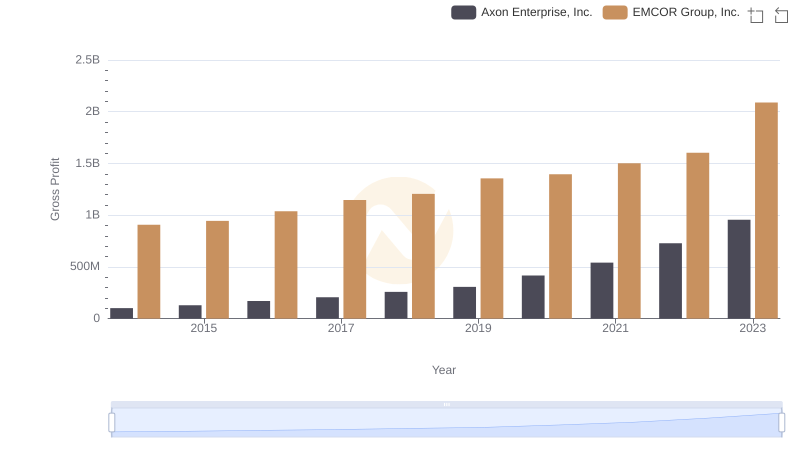
Key Insights on Gross Profit: Axon Enterprise, Inc. vs EMCOR Group, Inc.
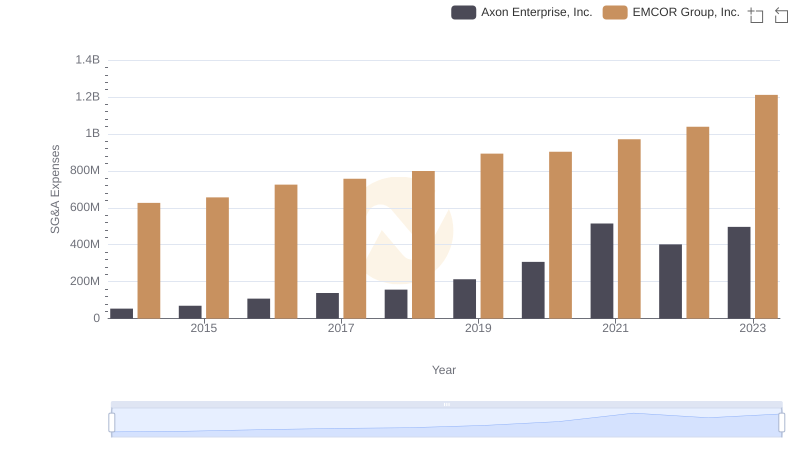
SG&A Efficiency Analysis: Comparing Axon Enterprise, Inc. and EMCOR Group, Inc.