| __timestamp | Axon Enterprise, Inc. | Southwest Airlines Co. |
|---|---|---|
| Wednesday, January 1, 2014 | 62977000 | 14049000000 |
| Thursday, January 1, 2015 | 69245000 | 13423000000 |
| Friday, January 1, 2016 | 97709000 | 14151000000 |
| Sunday, January 1, 2017 | 136710000 | 14968000000 |
| Monday, January 1, 2018 | 161485000 | 15907000000 |
| Tuesday, January 1, 2019 | 223574000 | 16445000000 |
| Wednesday, January 1, 2020 | 264672000 | 10938000000 |
| Friday, January 1, 2021 | 322471000 | 11675000000 |
| Saturday, January 1, 2022 | 461297000 | 19062000000 |
| Sunday, January 1, 2023 | 608009000 | 21868000000 |
| Monday, January 1, 2024 | 23024000000 |
Unleashing the power of data
In the ever-evolving landscape of American business, understanding cost dynamics is crucial. This analysis delves into the cost of revenue trends for Axon Enterprise, Inc. and Southwest Airlines Co. from 2014 to 2023. Over this period, Axon Enterprise, a leader in public safety technology, saw its cost of revenue grow by nearly 866%, reflecting its aggressive expansion and innovation strategies. Meanwhile, Southwest Airlines, a stalwart in the aviation industry, experienced a more modest increase of around 56%, highlighting its focus on operational efficiency amidst fluctuating fuel prices and economic challenges.
These trends offer a window into the strategic priorities and market conditions faced by these two distinct yet influential companies.

Cost of Revenue Comparison: Axon Enterprise, Inc. vs Dover Corporation
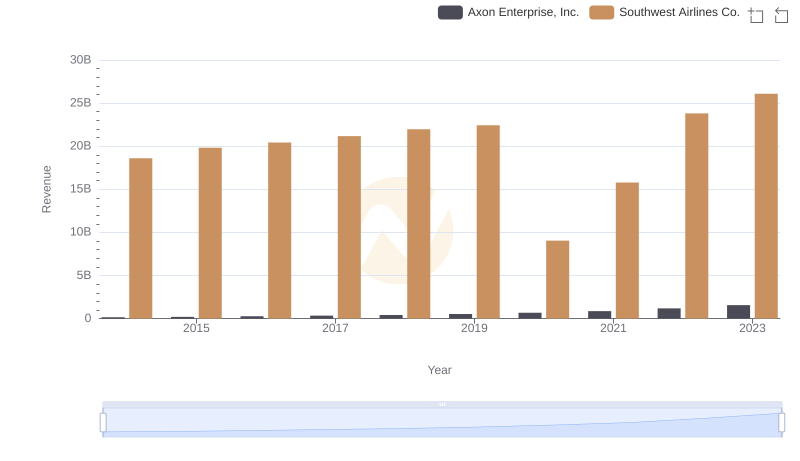
Revenue Showdown: Axon Enterprise, Inc. vs Southwest Airlines Co.
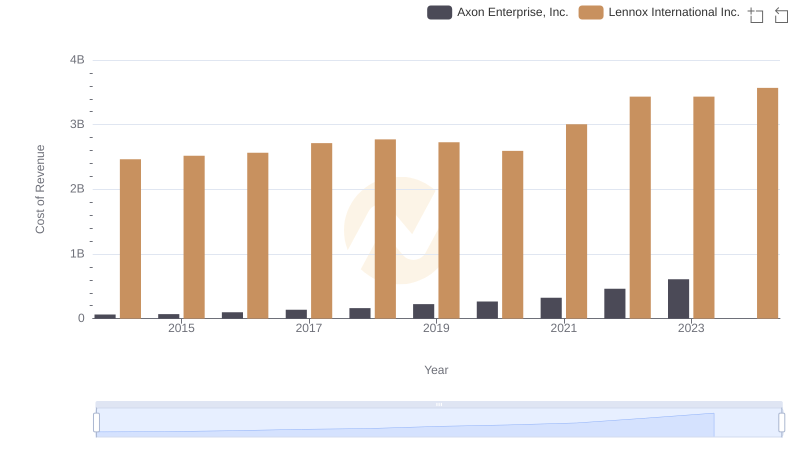
Cost of Revenue Trends: Axon Enterprise, Inc. vs Lennox International Inc.
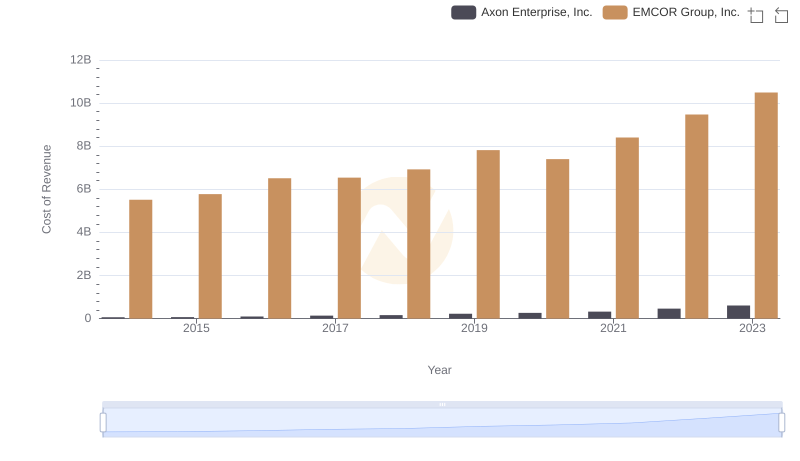
Cost of Revenue Comparison: Axon Enterprise, Inc. vs EMCOR Group, Inc.
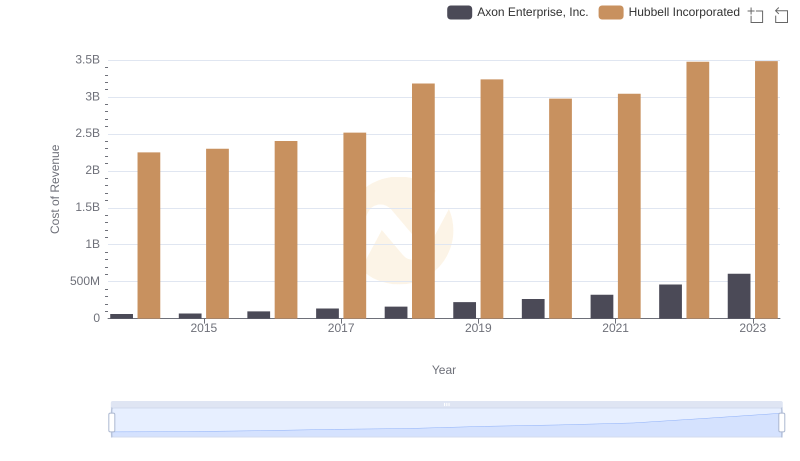
Analyzing Cost of Revenue: Axon Enterprise, Inc. and Hubbell Incorporated
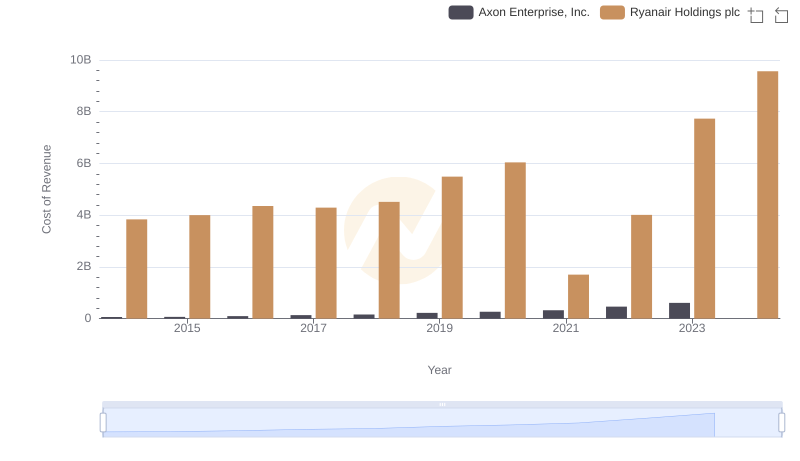
Comparing Cost of Revenue Efficiency: Axon Enterprise, Inc. vs Ryanair Holdings plc
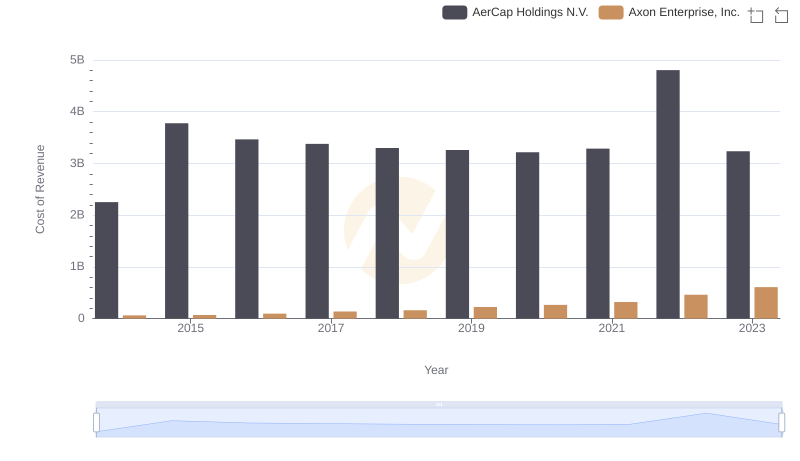
Cost of Revenue: Key Insights for Axon Enterprise, Inc. and AerCap Holdings N.V.
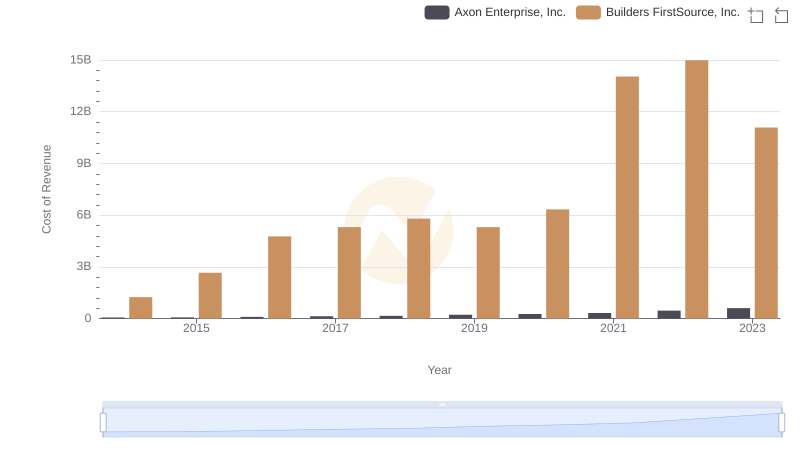
Axon Enterprise, Inc. vs Builders FirstSource, Inc.: Efficiency in Cost of Revenue Explored
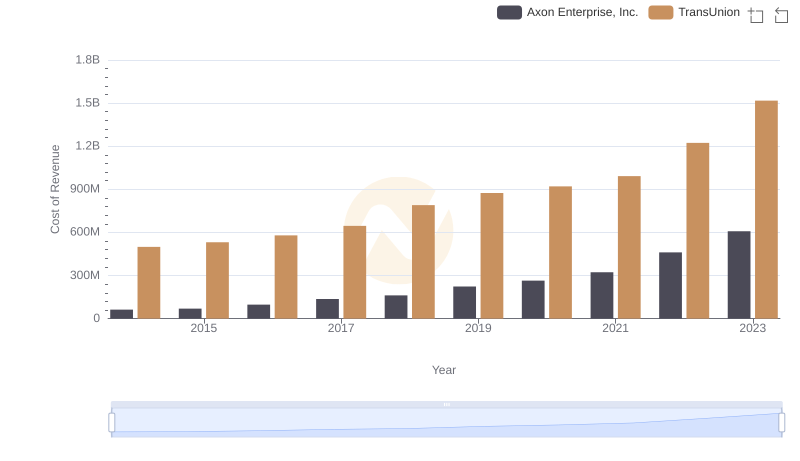
Cost Insights: Breaking Down Axon Enterprise, Inc. and TransUnion's Expenses
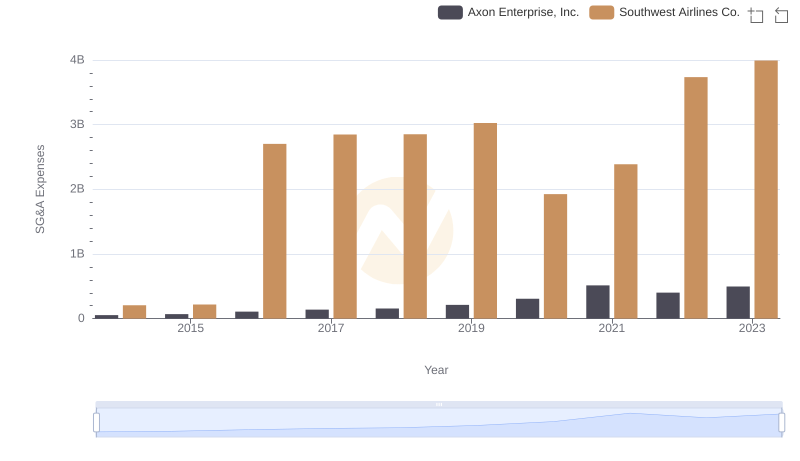
Who Optimizes SG&A Costs Better? Axon Enterprise, Inc. or Southwest Airlines Co.
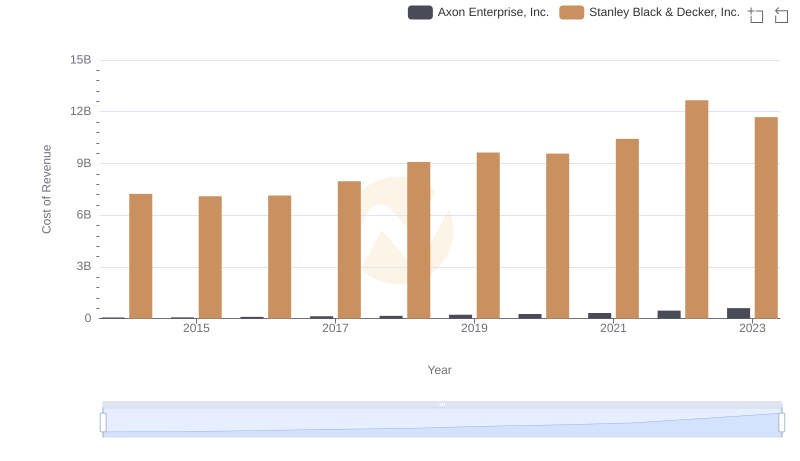
Cost of Revenue Trends: Axon Enterprise, Inc. vs Stanley Black & Decker, Inc.