| __timestamp | Axon Enterprise, Inc. | Hubbell Incorporated |
|---|---|---|
| Wednesday, January 1, 2014 | 62977000 | 2250400000 |
| Thursday, January 1, 2015 | 69245000 | 2298600000 |
| Friday, January 1, 2016 | 97709000 | 2404500000 |
| Sunday, January 1, 2017 | 136710000 | 2516900000 |
| Monday, January 1, 2018 | 161485000 | 3181300000 |
| Tuesday, January 1, 2019 | 223574000 | 3238300000 |
| Wednesday, January 1, 2020 | 264672000 | 2976700000 |
| Friday, January 1, 2021 | 322471000 | 3042600000 |
| Saturday, January 1, 2022 | 461297000 | 3476300000 |
| Sunday, January 1, 2023 | 608009000 | 3484800000 |
| Monday, January 1, 2024 | 3724400000 |
Cracking the code
In the ever-evolving landscape of American industry, understanding the cost of revenue is crucial for evaluating a company's financial health. This analysis focuses on two prominent players: Axon Enterprise, Inc. and Hubbell Incorporated, from 2014 to 2023. Over this period, Axon Enterprise, Inc. has seen a staggering increase in its cost of revenue, growing nearly tenfold from approximately $63 million in 2014 to over $608 million in 2023. This reflects Axon's aggressive expansion and investment in its product offerings. Meanwhile, Hubbell Incorporated, a stalwart in the electrical products sector, has maintained a more stable trajectory, with its cost of revenue increasing by about 55% from $2.25 billion to $3.48 billion. This stability underscores Hubbell's consistent market presence and operational efficiency. As these companies continue to evolve, their cost of revenue trends offer valuable insights into their strategic priorities and market dynamics.
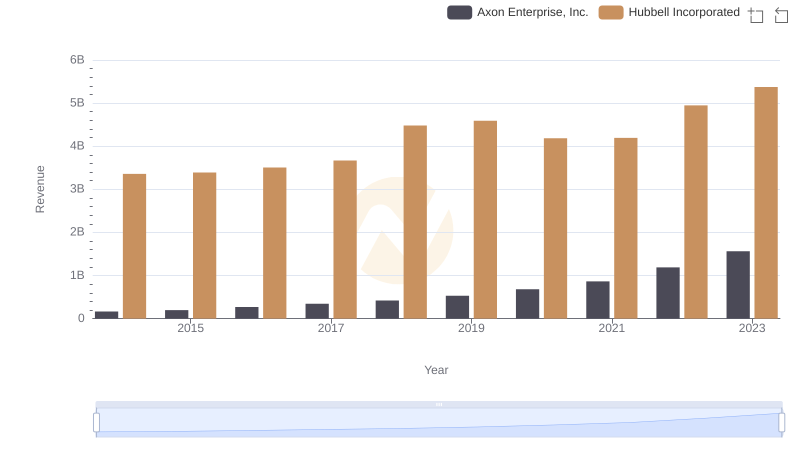
Comparing Revenue Performance: Axon Enterprise, Inc. or Hubbell Incorporated?
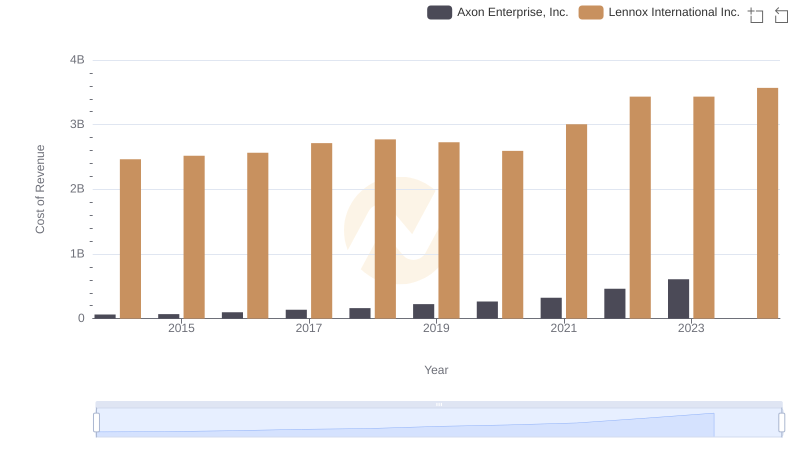
Cost of Revenue Trends: Axon Enterprise, Inc. vs Lennox International Inc.
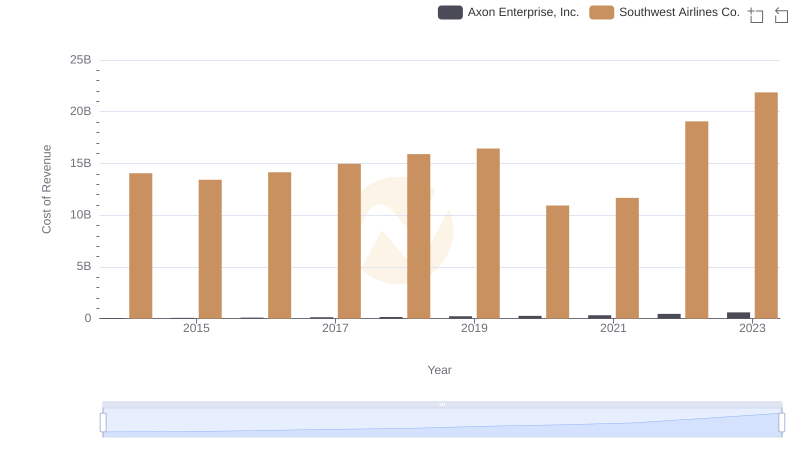
Cost of Revenue Trends: Axon Enterprise, Inc. vs Southwest Airlines Co.
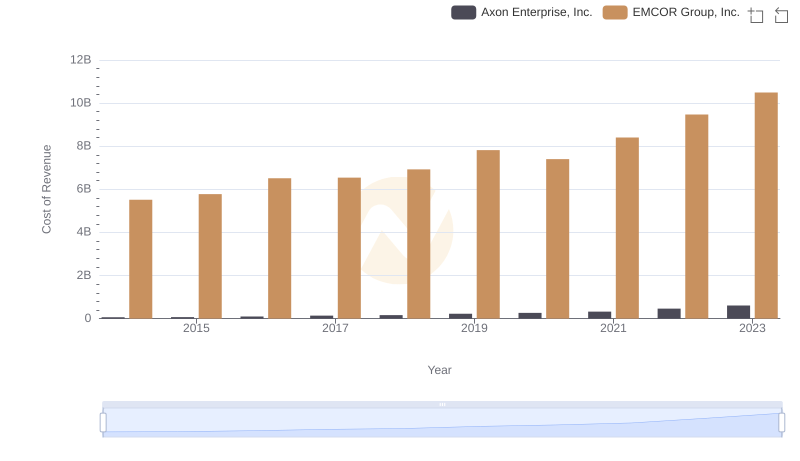
Cost of Revenue Comparison: Axon Enterprise, Inc. vs EMCOR Group, Inc.
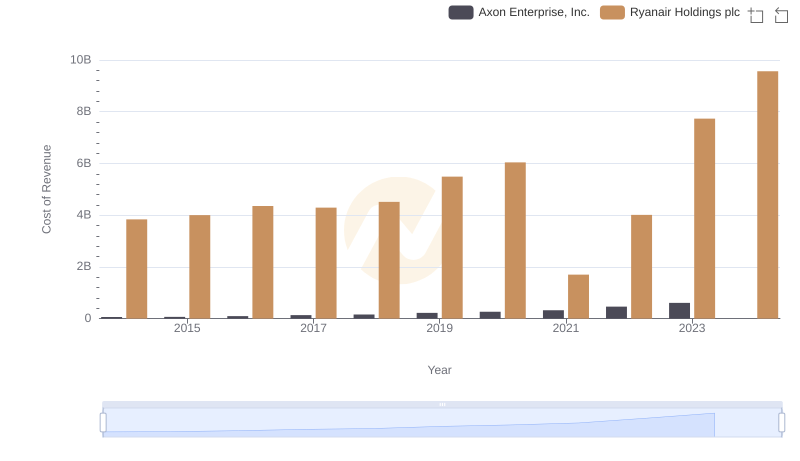
Comparing Cost of Revenue Efficiency: Axon Enterprise, Inc. vs Ryanair Holdings plc
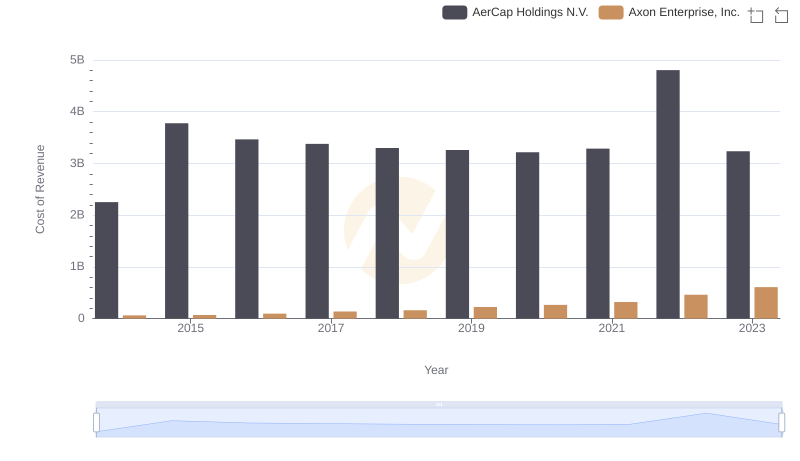
Cost of Revenue: Key Insights for Axon Enterprise, Inc. and AerCap Holdings N.V.
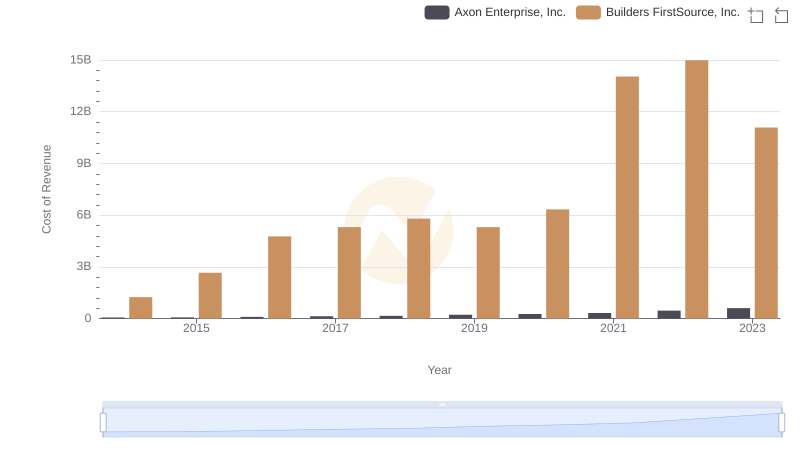
Axon Enterprise, Inc. vs Builders FirstSource, Inc.: Efficiency in Cost of Revenue Explored
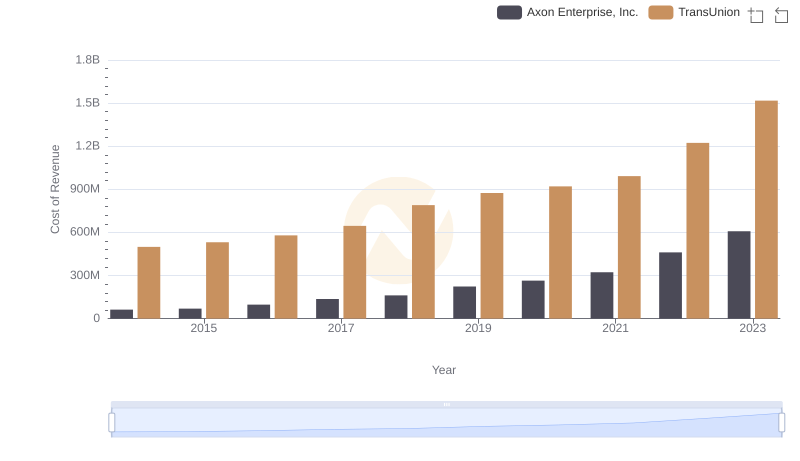
Cost Insights: Breaking Down Axon Enterprise, Inc. and TransUnion's Expenses
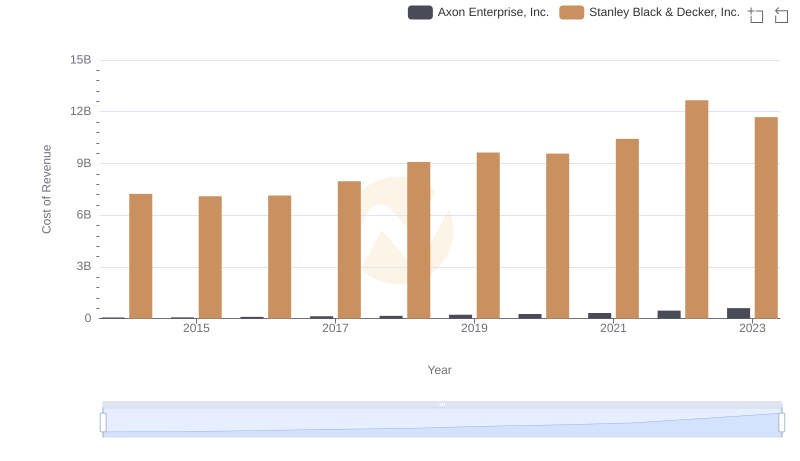
Cost of Revenue Trends: Axon Enterprise, Inc. vs Stanley Black & Decker, Inc.
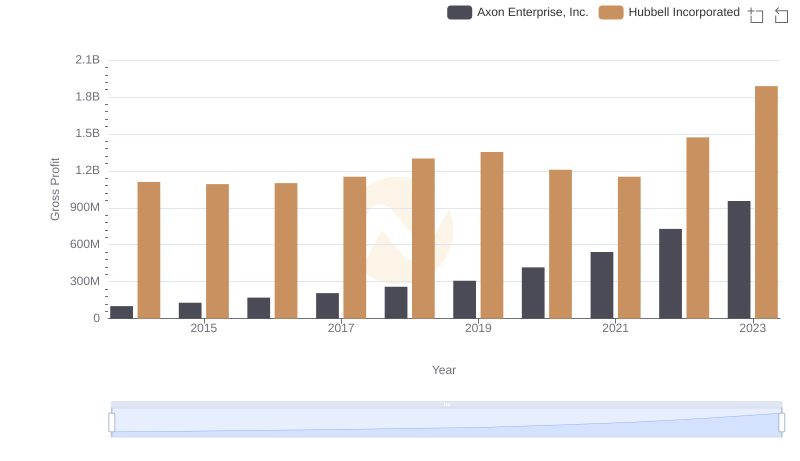
Key Insights on Gross Profit: Axon Enterprise, Inc. vs Hubbell Incorporated