| __timestamp | Axon Enterprise, Inc. | Lennox International Inc. |
|---|---|---|
| Wednesday, January 1, 2014 | 62977000 | 2464100000 |
| Thursday, January 1, 2015 | 69245000 | 2520000000 |
| Friday, January 1, 2016 | 97709000 | 2565100000 |
| Sunday, January 1, 2017 | 136710000 | 2714400000 |
| Monday, January 1, 2018 | 161485000 | 2772700000 |
| Tuesday, January 1, 2019 | 223574000 | 2727400000 |
| Wednesday, January 1, 2020 | 264672000 | 2594000000 |
| Friday, January 1, 2021 | 322471000 | 3005700000 |
| Saturday, January 1, 2022 | 461297000 | 3433700000 |
| Sunday, January 1, 2023 | 608009000 | 3434100000 |
| Monday, January 1, 2024 | 3569400000 |
Unleashing the power of data
In the ever-evolving landscape of American industry, understanding cost dynamics is crucial. From 2014 to 2023, Axon Enterprise, Inc. and Lennox International Inc. have shown distinct trajectories in their cost of revenue. Axon, a leader in public safety technology, has seen its costs rise dramatically, increasing nearly tenfold from 2014 to 2023. This reflects its aggressive growth strategy and expanding market presence. In contrast, Lennox International, a stalwart in climate control solutions, has maintained a more stable cost structure, with a modest 40% increase over the same period. This stability underscores Lennox's mature market position and operational efficiency. Notably, 2024 data for Axon is missing, hinting at potential shifts or reporting delays. These trends offer a window into the strategic priorities and market conditions faced by these industry giants.

Revenue Insights: Axon Enterprise, Inc. and Lennox International Inc. Performance Compared

Cost of Revenue Comparison: Axon Enterprise, Inc. vs Dover Corporation
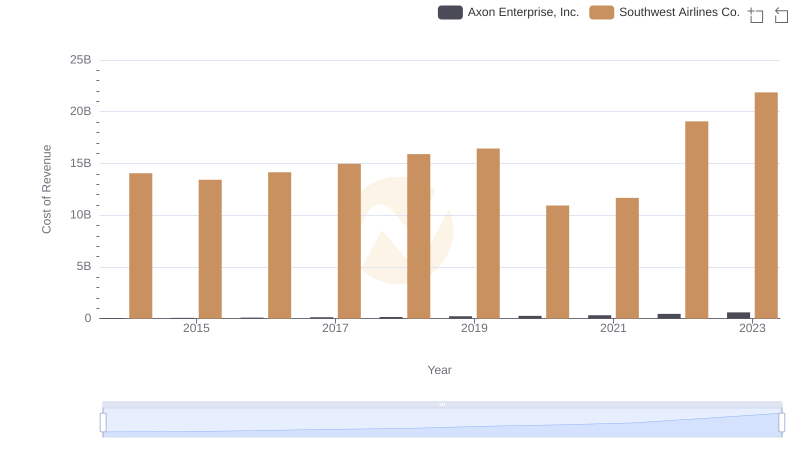
Cost of Revenue Trends: Axon Enterprise, Inc. vs Southwest Airlines Co.
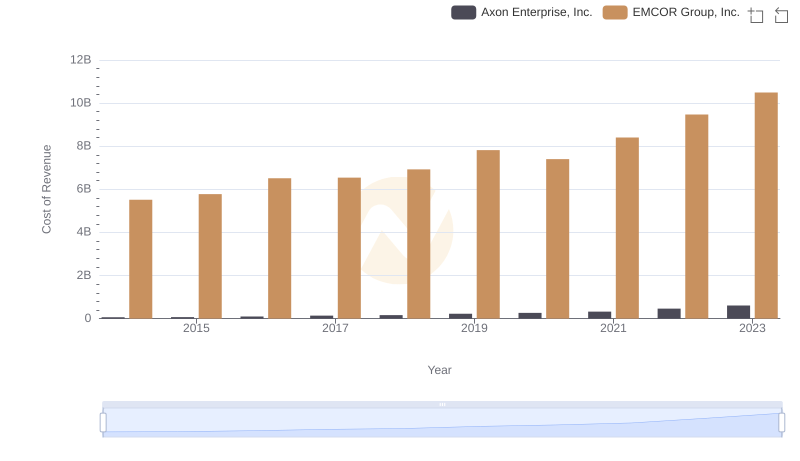
Cost of Revenue Comparison: Axon Enterprise, Inc. vs EMCOR Group, Inc.
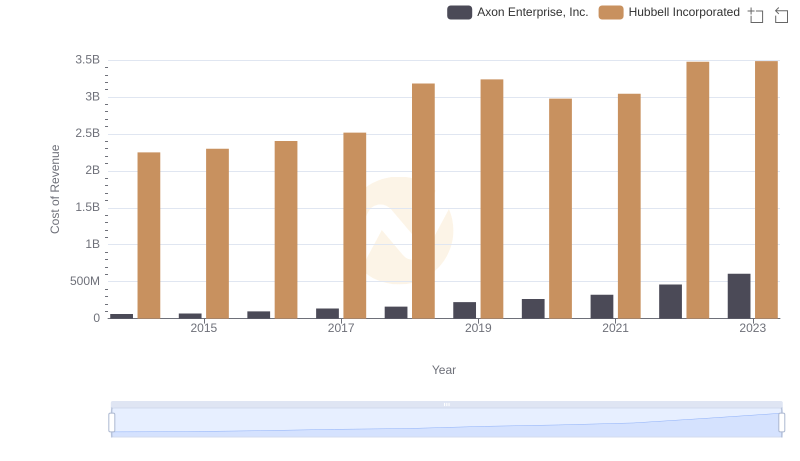
Analyzing Cost of Revenue: Axon Enterprise, Inc. and Hubbell Incorporated
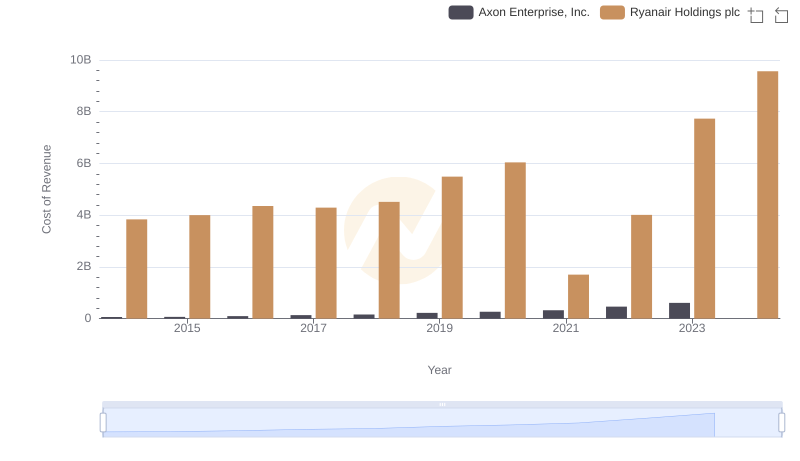
Comparing Cost of Revenue Efficiency: Axon Enterprise, Inc. vs Ryanair Holdings plc
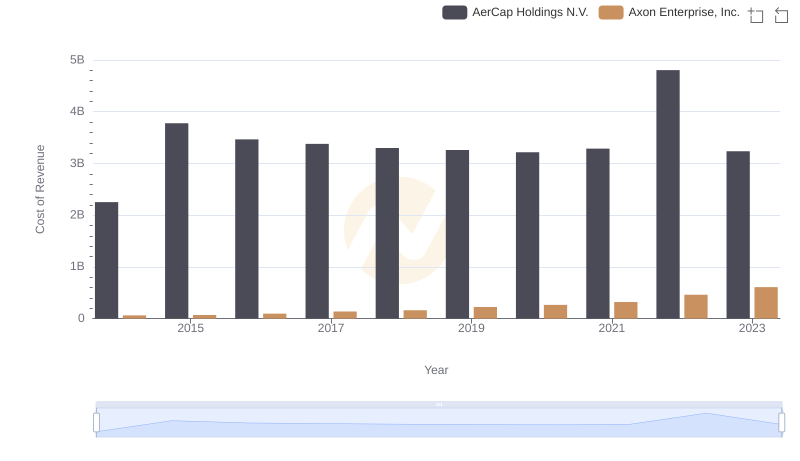
Cost of Revenue: Key Insights for Axon Enterprise, Inc. and AerCap Holdings N.V.
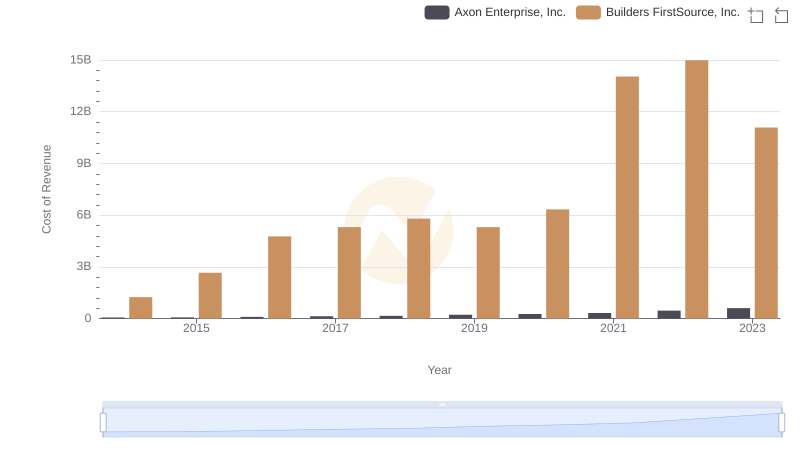
Axon Enterprise, Inc. vs Builders FirstSource, Inc.: Efficiency in Cost of Revenue Explored
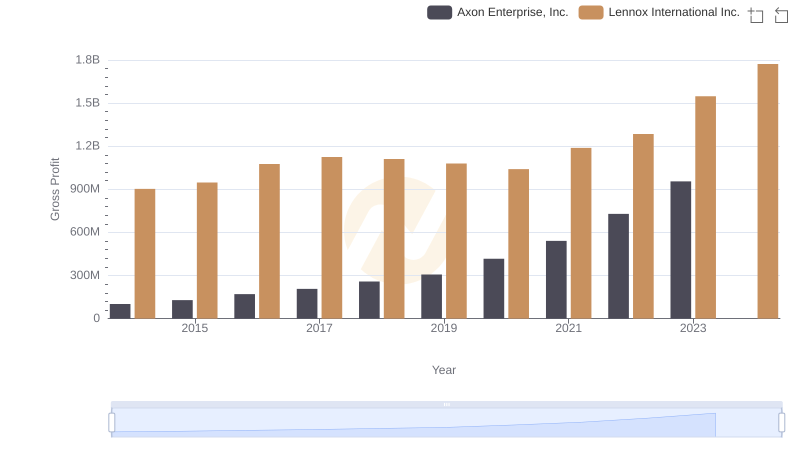
Gross Profit Analysis: Comparing Axon Enterprise, Inc. and Lennox International Inc.
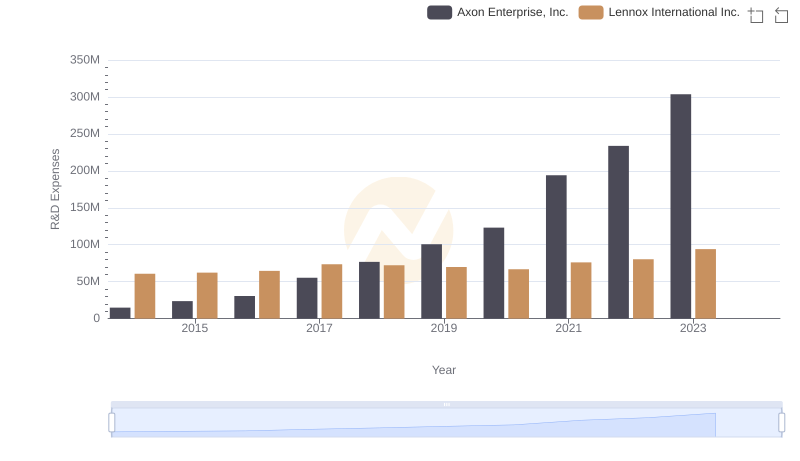
Who Prioritizes Innovation? R&D Spending Compared for Axon Enterprise, Inc. and Lennox International Inc.
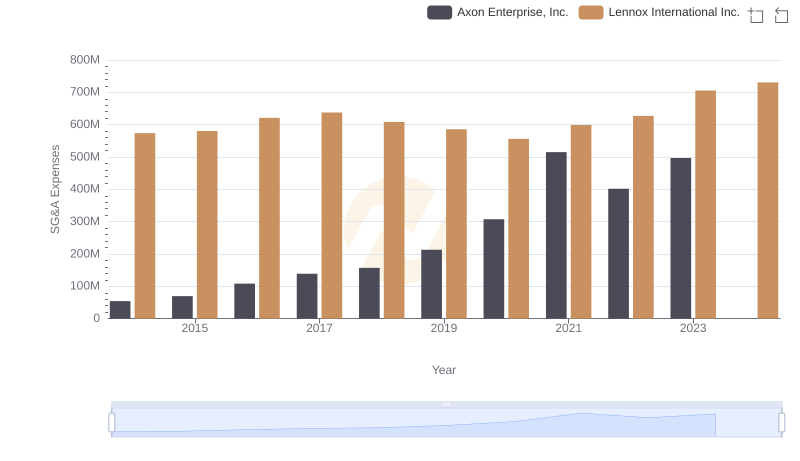
Axon Enterprise, Inc. and Lennox International Inc.: SG&A Spending Patterns Compared