| __timestamp | Axon Enterprise, Inc. | TransUnion |
|---|---|---|
| Wednesday, January 1, 2014 | 164525000 | 1304700000 |
| Thursday, January 1, 2015 | 197892000 | 1506800000 |
| Friday, January 1, 2016 | 268245000 | 1704900000 |
| Sunday, January 1, 2017 | 343798000 | 1933800000 |
| Monday, January 1, 2018 | 420068000 | 2317200000 |
| Tuesday, January 1, 2019 | 530860000 | 2656100000 |
| Wednesday, January 1, 2020 | 681003000 | 2716600000 |
| Friday, January 1, 2021 | 863381000 | 2960200000 |
| Saturday, January 1, 2022 | 1189935000 | 3709900000 |
| Sunday, January 1, 2023 | 1563391000 | 3831200000 |
| Monday, January 1, 2024 | 4183800000 |
In pursuit of knowledge
In the dynamic landscape of the U.S. stock market, understanding revenue trends is crucial for investors and analysts alike. This chart offers a compelling comparison between Axon Enterprise, Inc. and TransUnion from 2014 to 2023. Over this period, Axon Enterprise, Inc. has demonstrated a remarkable growth trajectory, with its revenue surging by approximately 850%, from $165 million in 2014 to $1.56 billion in 2023. Meanwhile, TransUnion, a leader in credit reporting, has seen its revenue grow by nearly 200%, reaching $3.83 billion in 2023 from $1.30 billion in 2014.
This data highlights Axon's aggressive expansion strategy, outpacing TransUnion's steady growth. Investors should note the significant upward trend in Axon's revenue, reflecting its increasing market presence and innovation in public safety technology. As the financial landscape evolves, these insights provide a valuable perspective on the competitive dynamics between these two industry giants.

Revenue Insights: Axon Enterprise, Inc. and Lennox International Inc. Performance Compared
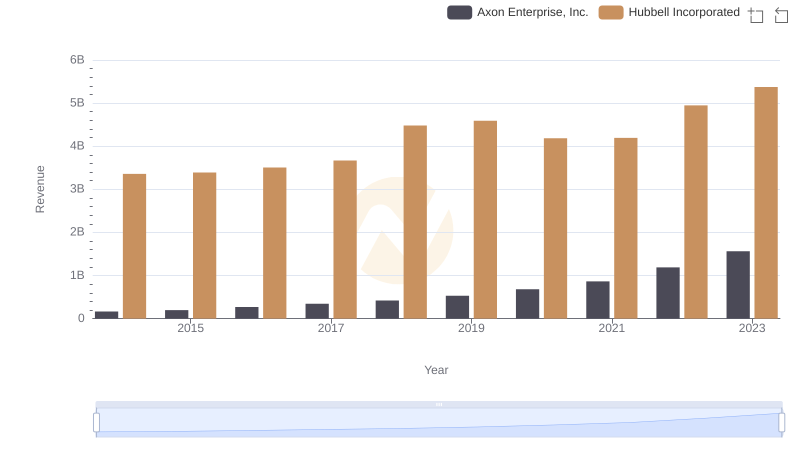
Comparing Revenue Performance: Axon Enterprise, Inc. or Hubbell Incorporated?
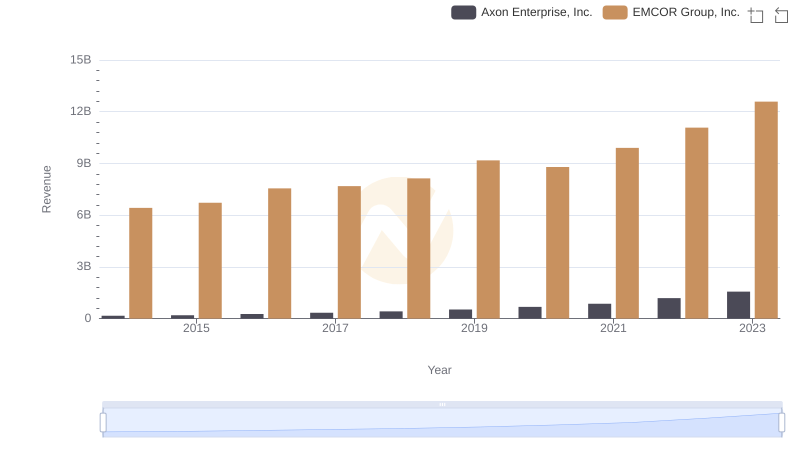
Comparing Revenue Performance: Axon Enterprise, Inc. or EMCOR Group, Inc.?
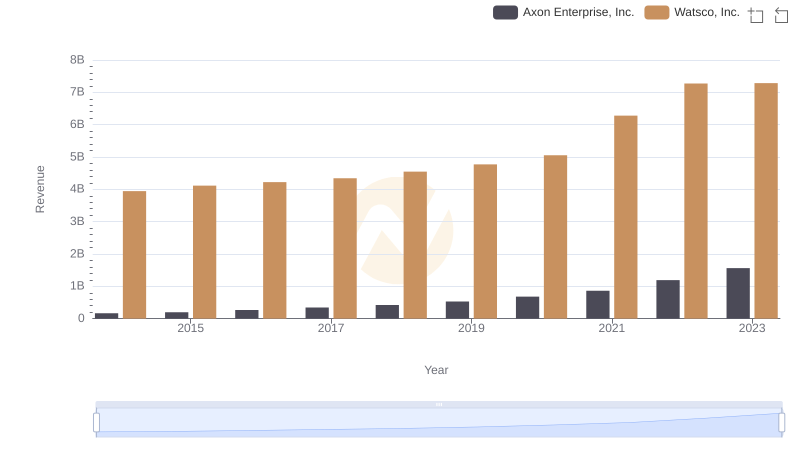
Axon Enterprise, Inc. vs Watsco, Inc.: Examining Key Revenue Metrics
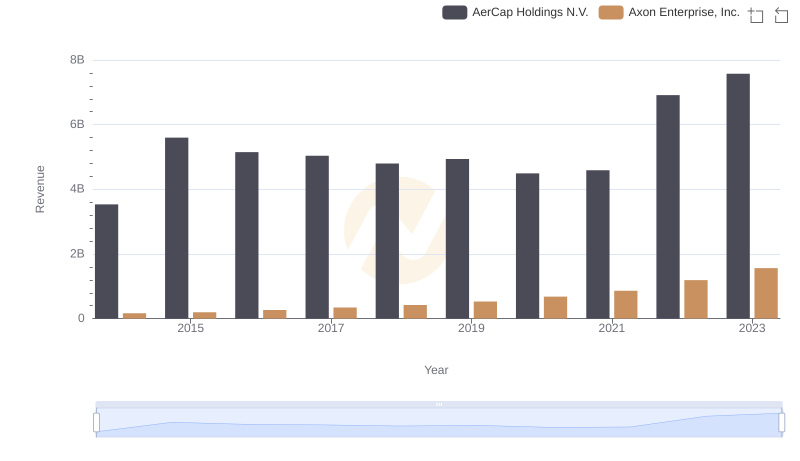
Comparing Revenue Performance: Axon Enterprise, Inc. or AerCap Holdings N.V.?
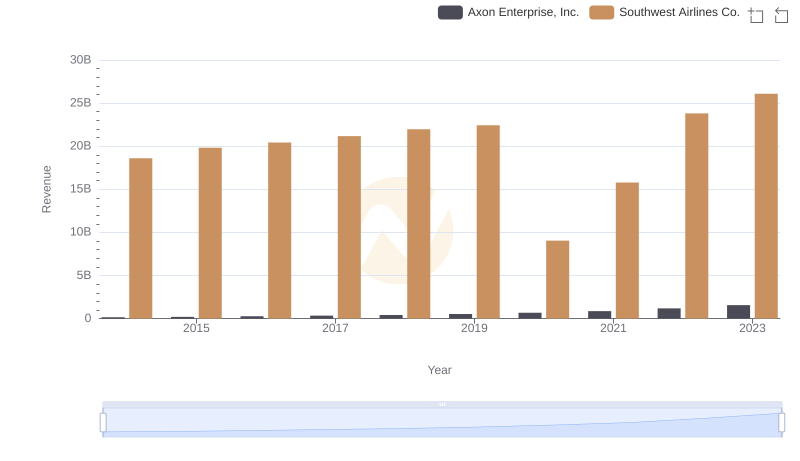
Revenue Showdown: Axon Enterprise, Inc. vs Southwest Airlines Co.
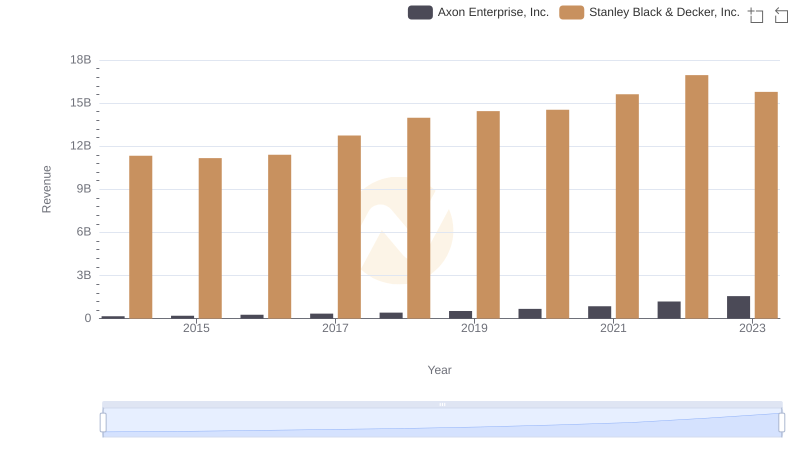
Revenue Showdown: Axon Enterprise, Inc. vs Stanley Black & Decker, Inc.
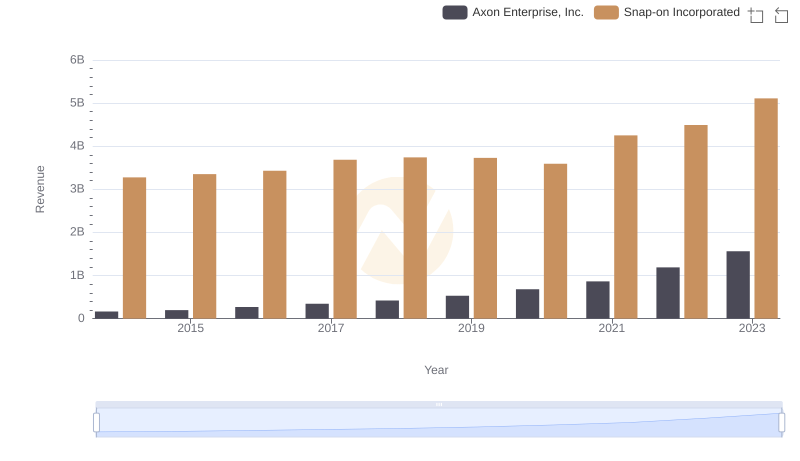
Axon Enterprise, Inc. vs Snap-on Incorporated: Examining Key Revenue Metrics
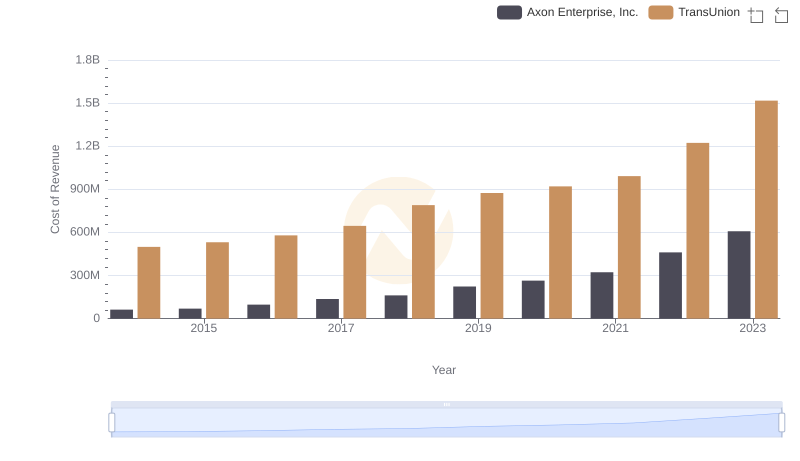
Cost Insights: Breaking Down Axon Enterprise, Inc. and TransUnion's Expenses
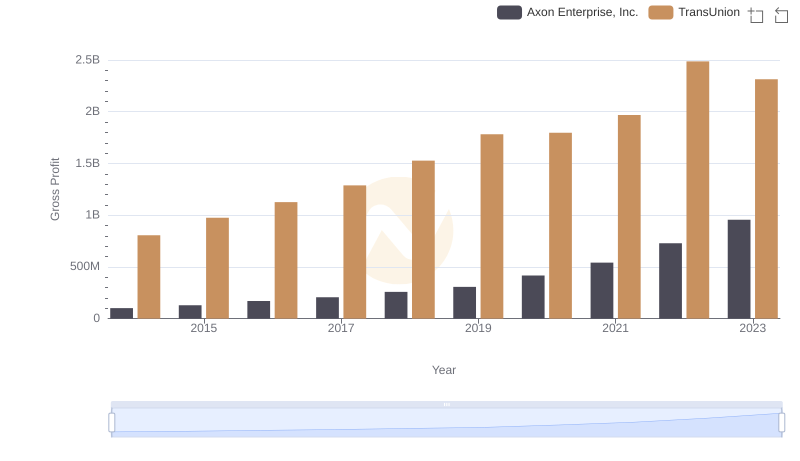
Gross Profit Comparison: Axon Enterprise, Inc. and TransUnion Trends
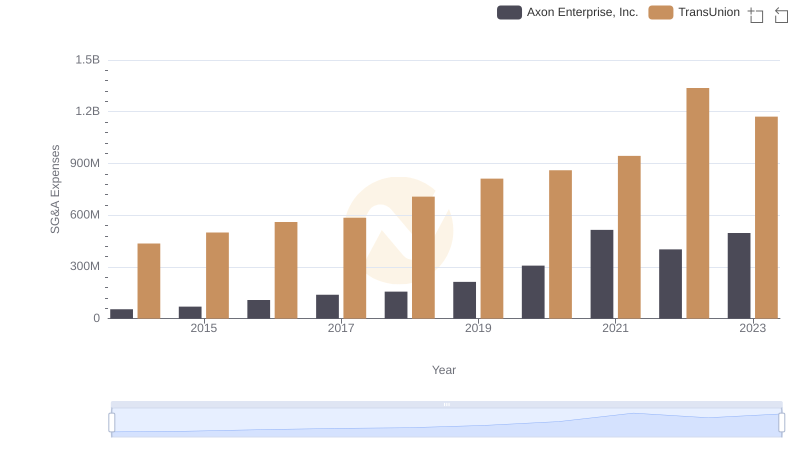
Selling, General, and Administrative Costs: Axon Enterprise, Inc. vs TransUnion