| __timestamp | Axon Enterprise, Inc. | Builders FirstSource, Inc. |
|---|---|---|
| Wednesday, January 1, 2014 | 62977000 | 1247099000 |
| Thursday, January 1, 2015 | 69245000 | 2662967000 |
| Friday, January 1, 2016 | 97709000 | 4770536000 |
| Sunday, January 1, 2017 | 136710000 | 5306818000 |
| Monday, January 1, 2018 | 161485000 | 5801831000 |
| Tuesday, January 1, 2019 | 223574000 | 5303602000 |
| Wednesday, January 1, 2020 | 264672000 | 6336290000 |
| Friday, January 1, 2021 | 322471000 | 14042900000 |
| Saturday, January 1, 2022 | 461297000 | 14982039000 |
| Sunday, January 1, 2023 | 608009000 | 11084996000 |
In pursuit of knowledge
In the ever-evolving landscape of corporate efficiency, understanding cost dynamics is crucial. This analysis delves into the cost of revenue trends for Axon Enterprise, Inc. and Builders FirstSource, Inc. from 2014 to 2023. Over this period, Builders FirstSource, Inc. consistently outpaced Axon Enterprise, Inc. in cost of revenue, peaking at approximately $14.98 billion in 2022, a staggering 2,360% increase from 2014. In contrast, Axon Enterprise, Inc. saw a more modest growth, with a 866% increase, reaching around $608 million in 2023. This disparity highlights Builders FirstSource, Inc.'s expansive operational scale compared to Axon Enterprise, Inc. The data underscores the importance of strategic cost management in maintaining competitive advantage. As businesses navigate the complexities of modern markets, these insights offer a window into the financial strategies that drive success.
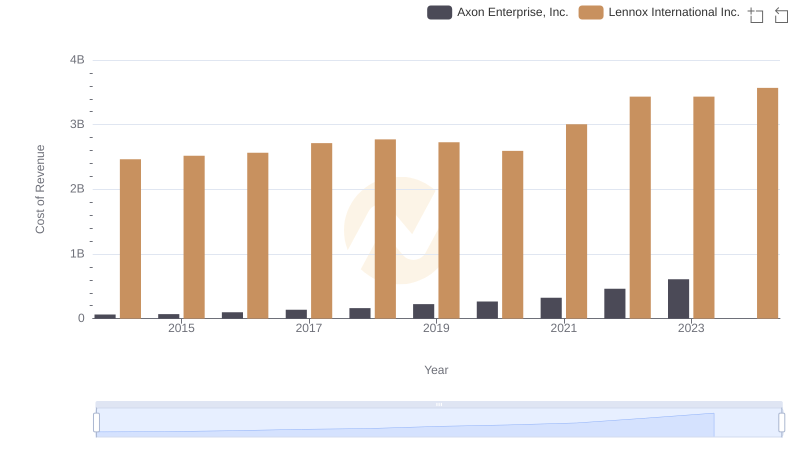
Cost of Revenue Trends: Axon Enterprise, Inc. vs Lennox International Inc.
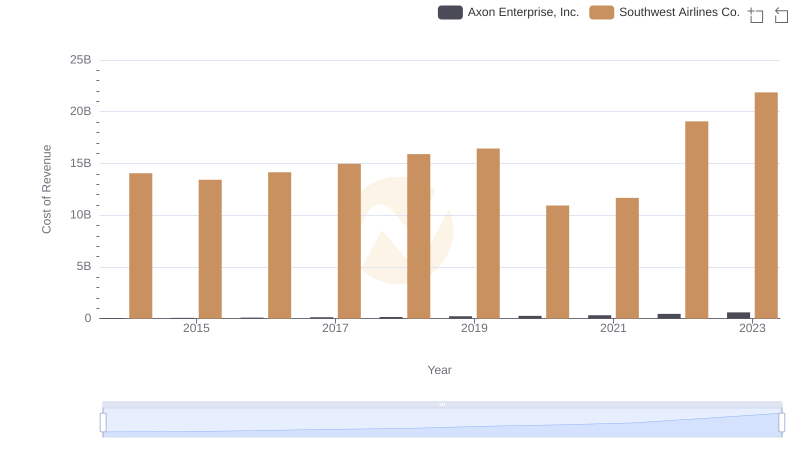
Cost of Revenue Trends: Axon Enterprise, Inc. vs Southwest Airlines Co.
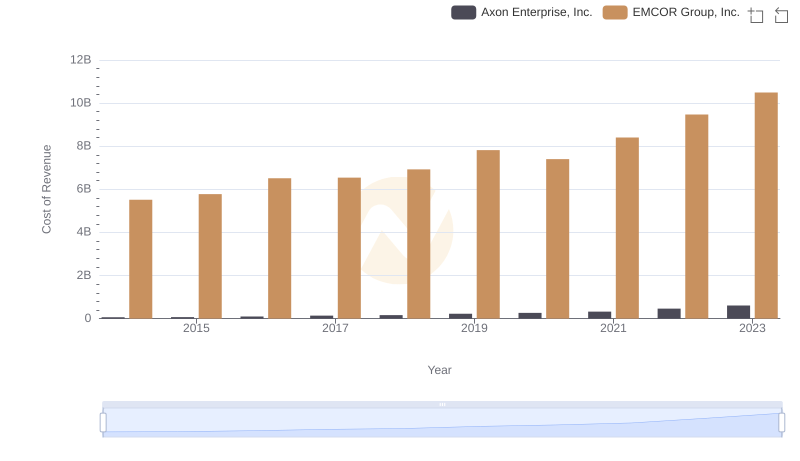
Cost of Revenue Comparison: Axon Enterprise, Inc. vs EMCOR Group, Inc.
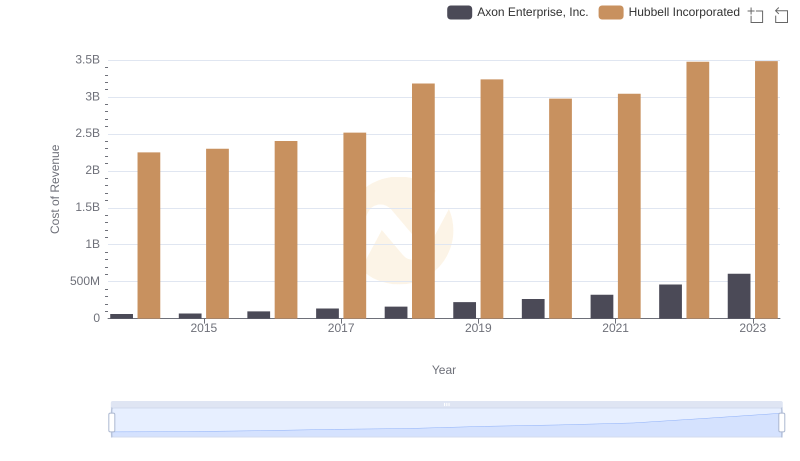
Analyzing Cost of Revenue: Axon Enterprise, Inc. and Hubbell Incorporated
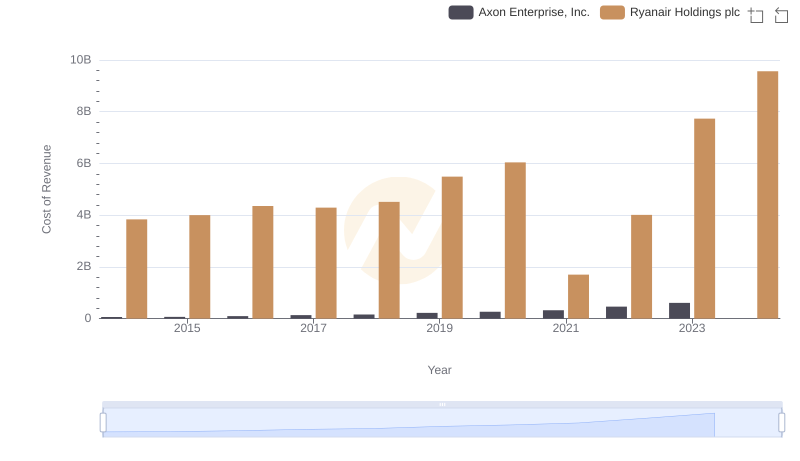
Comparing Cost of Revenue Efficiency: Axon Enterprise, Inc. vs Ryanair Holdings plc
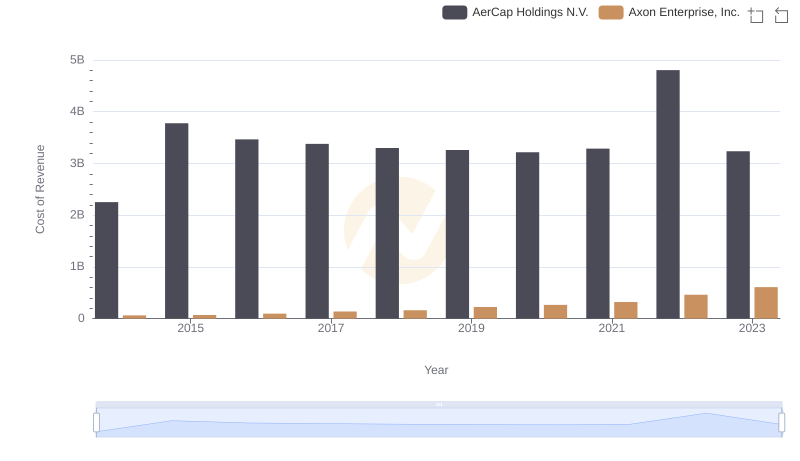
Cost of Revenue: Key Insights for Axon Enterprise, Inc. and AerCap Holdings N.V.
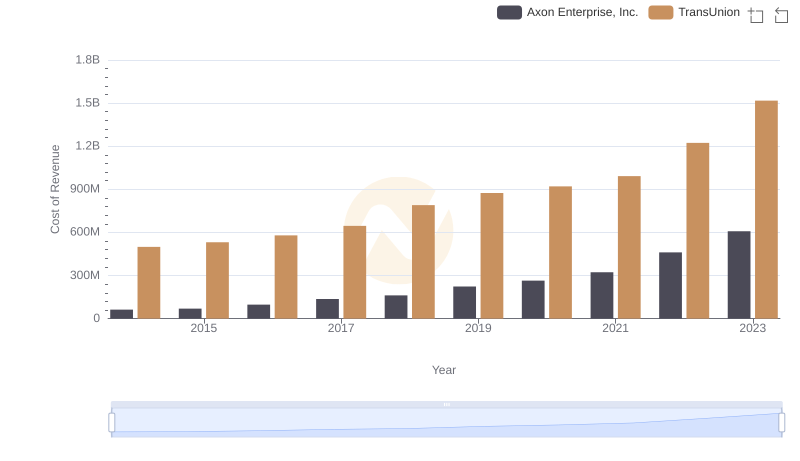
Cost Insights: Breaking Down Axon Enterprise, Inc. and TransUnion's Expenses
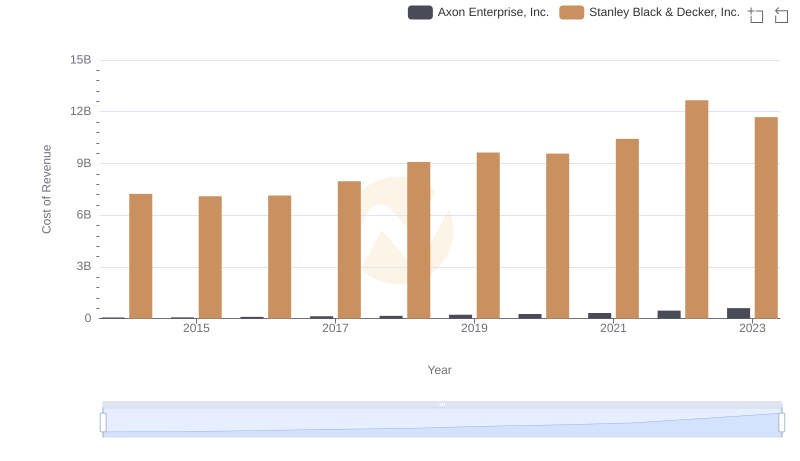
Cost of Revenue Trends: Axon Enterprise, Inc. vs Stanley Black & Decker, Inc.

Cost of Revenue: Key Insights for Axon Enterprise, Inc. and Snap-on Incorporated
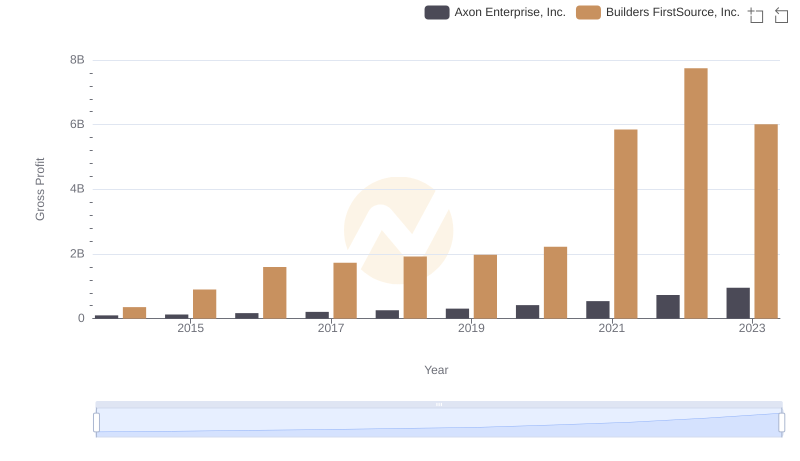
Gross Profit Trends Compared: Axon Enterprise, Inc. vs Builders FirstSource, Inc.

Axon Enterprise, Inc. vs Builders FirstSource, Inc.: SG&A Expense Trends