| __timestamp | Axon Enterprise, Inc. | TransUnion |
|---|---|---|
| Wednesday, January 1, 2014 | 101548000 | 805600000 |
| Thursday, January 1, 2015 | 128647000 | 975200000 |
| Friday, January 1, 2016 | 170536000 | 1125800000 |
| Sunday, January 1, 2017 | 207088000 | 1288100000 |
| Monday, January 1, 2018 | 258583000 | 1527100000 |
| Tuesday, January 1, 2019 | 307286000 | 1782000000 |
| Wednesday, January 1, 2020 | 416331000 | 1796200000 |
| Friday, January 1, 2021 | 540910000 | 1968600000 |
| Saturday, January 1, 2022 | 728638000 | 2487000000 |
| Sunday, January 1, 2023 | 955382000 | 2313900000 |
| Monday, January 1, 2024 | 4183800000 |
Unlocking the unknown
In the ever-evolving landscape of American business, the financial trajectories of Axon Enterprise, Inc. and TransUnion offer a fascinating glimpse into corporate growth over the past decade. From 2014 to 2023, Axon Enterprise, Inc. has seen its gross profit soar by an impressive 840%, reflecting its strategic innovations and market expansion. Meanwhile, TransUnion, a stalwart in the credit reporting industry, has experienced a robust 187% increase in gross profit, underscoring its resilience and adaptability in a competitive market.
Axon Enterprise, Inc. began 2014 with a modest gross profit, but by 2023, it had nearly reached the billion-dollar mark. This growth trajectory highlights the company's successful pivot towards technology-driven solutions. On the other hand, TransUnion's steady climb to over 2.3 billion in gross profit by 2023 showcases its ability to maintain market leadership while expanding its service offerings. These trends not only reflect the companies' individual strategies but also the broader economic shifts influencing the U.S. market.
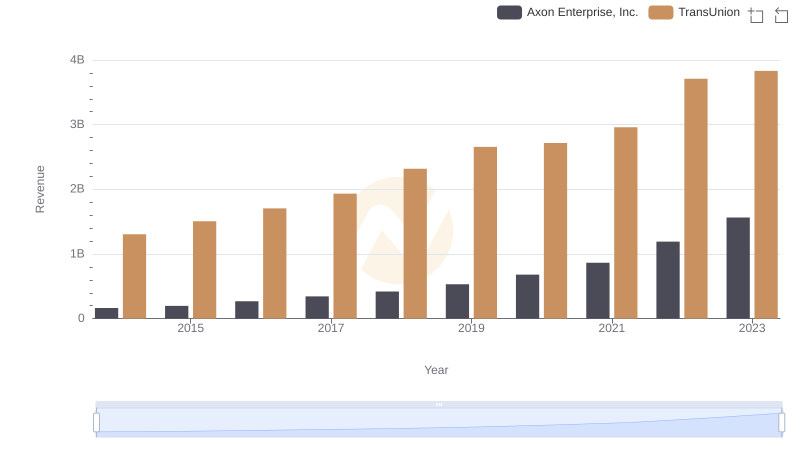
Breaking Down Revenue Trends: Axon Enterprise, Inc. vs TransUnion
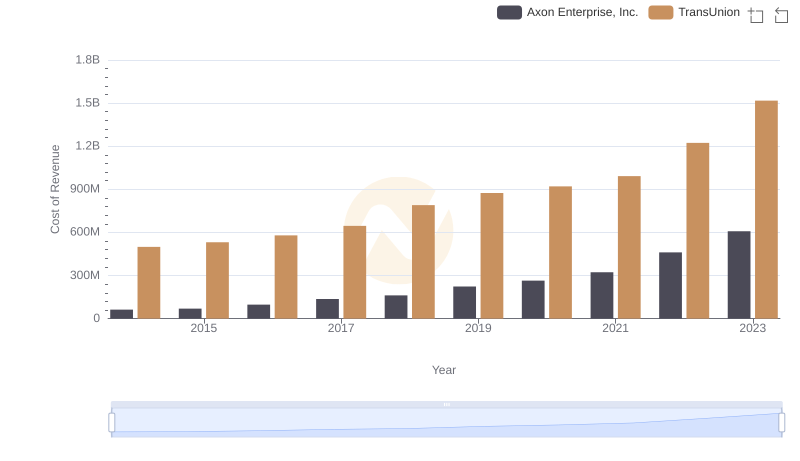
Cost Insights: Breaking Down Axon Enterprise, Inc. and TransUnion's Expenses
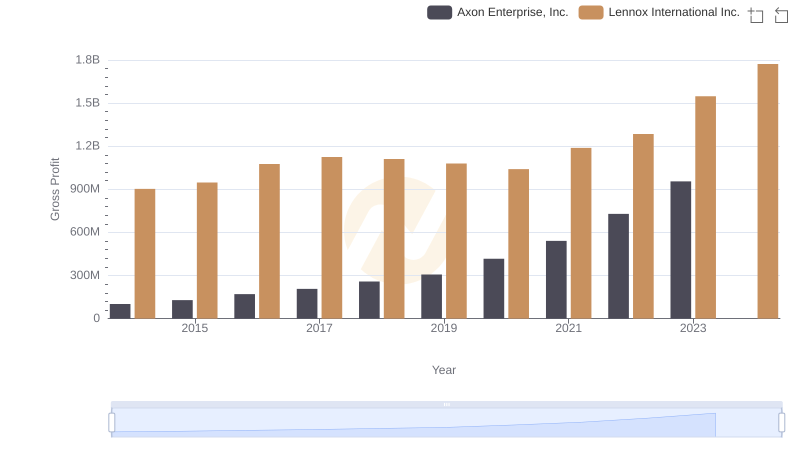
Gross Profit Analysis: Comparing Axon Enterprise, Inc. and Lennox International Inc.
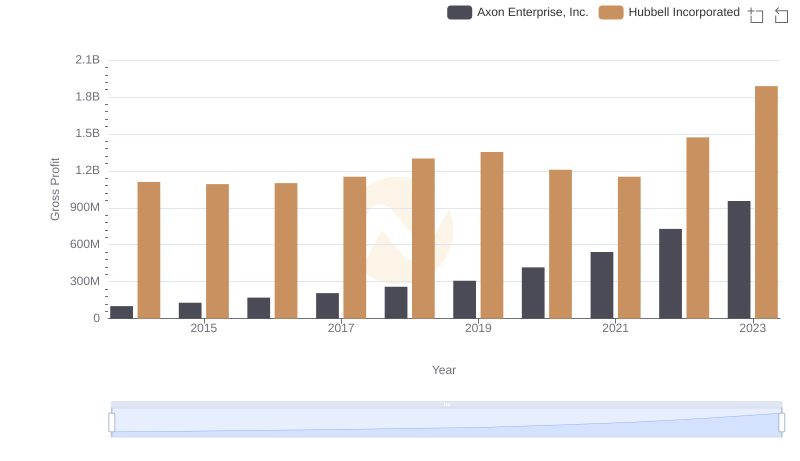
Key Insights on Gross Profit: Axon Enterprise, Inc. vs Hubbell Incorporated
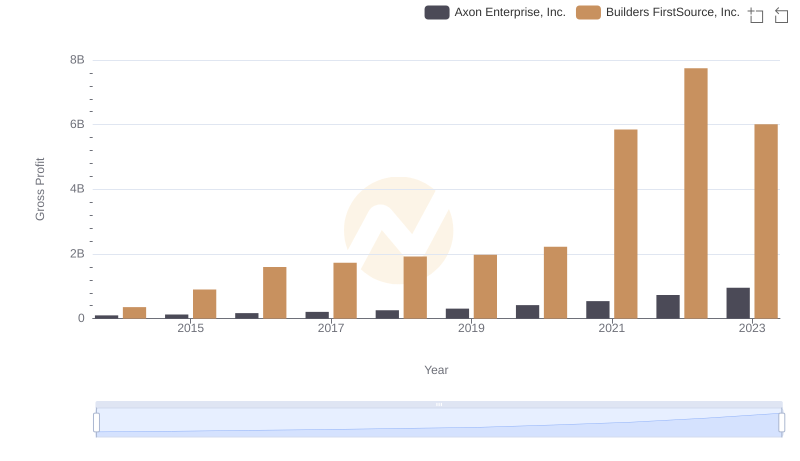
Gross Profit Trends Compared: Axon Enterprise, Inc. vs Builders FirstSource, Inc.
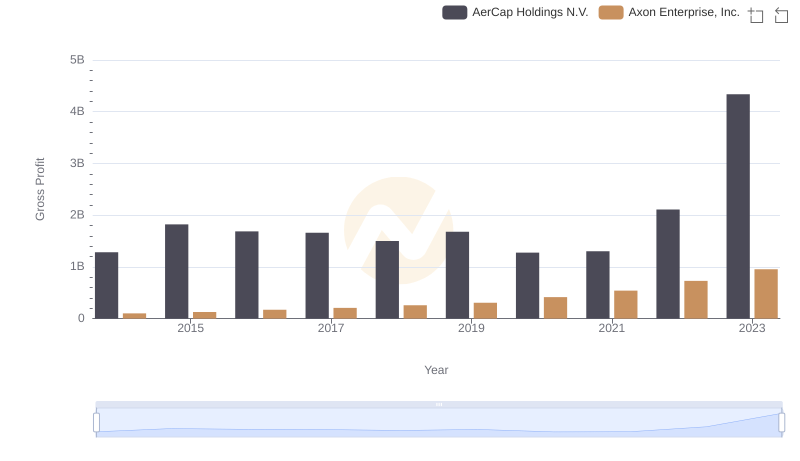
Key Insights on Gross Profit: Axon Enterprise, Inc. vs AerCap Holdings N.V.
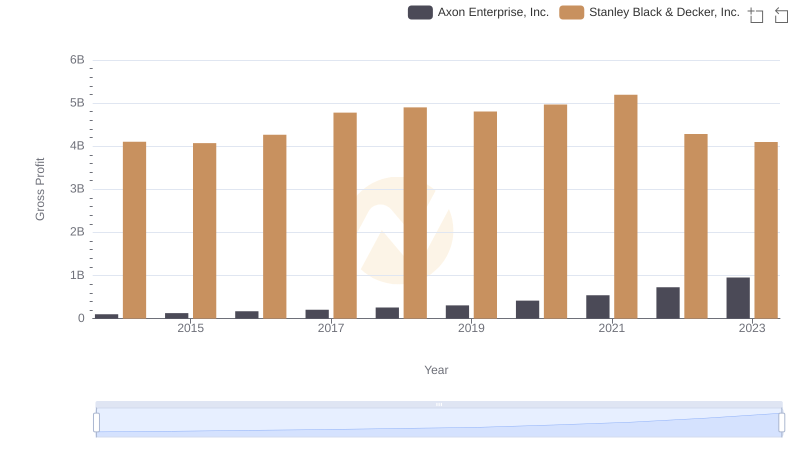
Axon Enterprise, Inc. and Stanley Black & Decker, Inc.: A Detailed Gross Profit Analysis
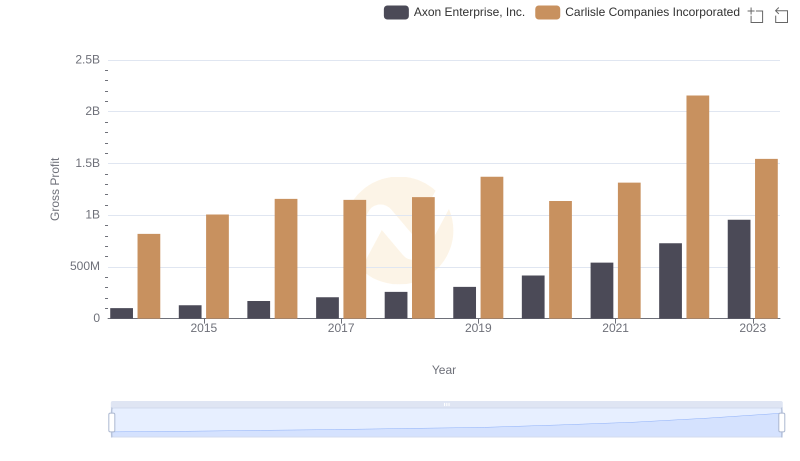
Gross Profit Trends Compared: Axon Enterprise, Inc. vs Carlisle Companies Incorporated
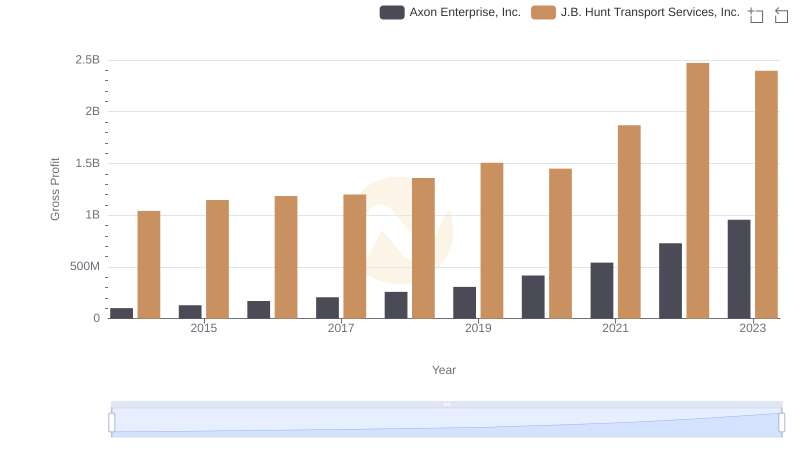
Gross Profit Comparison: Axon Enterprise, Inc. and J.B. Hunt Transport Services, Inc. Trends
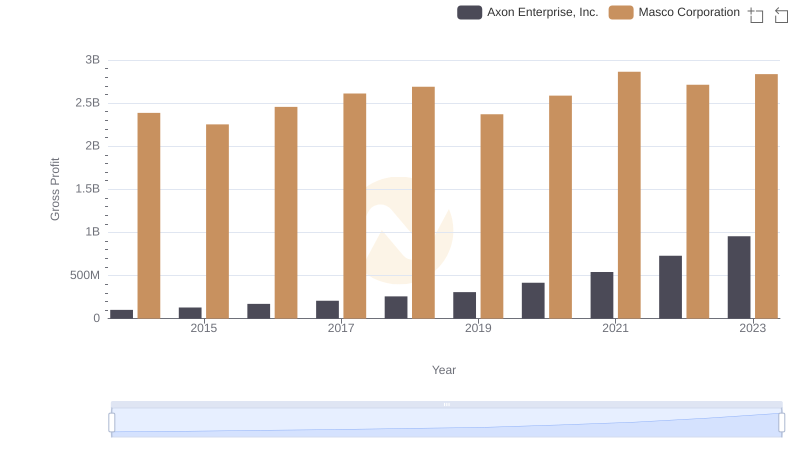
Axon Enterprise, Inc. and Masco Corporation: A Detailed Gross Profit Analysis
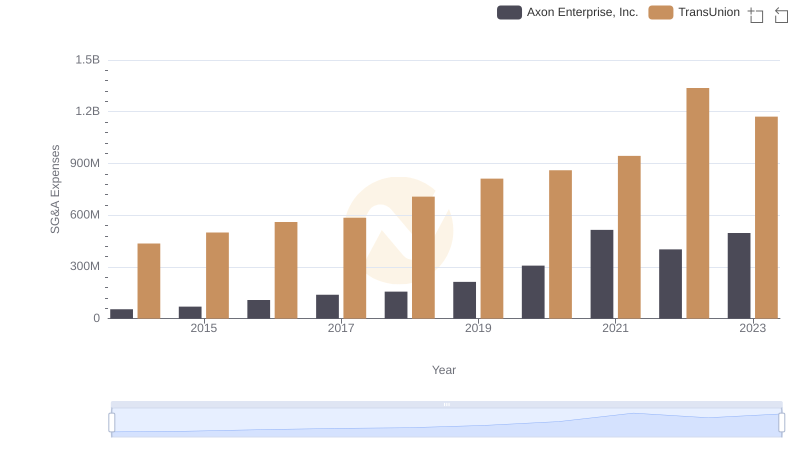
Selling, General, and Administrative Costs: Axon Enterprise, Inc. vs TransUnion