| __timestamp | AerCap Holdings N.V. | Rockwell Automation, Inc. |
|---|---|---|
| Wednesday, January 1, 2014 | 2997442000 | 1346000000 |
| Thursday, January 1, 2015 | 4313510000 | 1359100000 |
| Friday, January 1, 2016 | 4101801000 | 1200700000 |
| Sunday, January 1, 2017 | 4061381000 | 1258400000 |
| Monday, January 1, 2018 | 2874193000 | 1568400000 |
| Tuesday, January 1, 2019 | 3157061000 | 1150200000 |
| Wednesday, January 1, 2020 | 4028661000 | 1410200000 |
| Friday, January 1, 2021 | 3192341000 | 1808300000 |
| Saturday, January 1, 2022 | 6911148000 | 1432100000 |
| Sunday, January 1, 2023 | 4547656000 | 1990700000 |
| Monday, January 1, 2024 | 1567500000 |
Unleashing the power of data
In the ever-evolving landscape of industrial automation and aviation leasing, Rockwell Automation and AerCap Holdings stand as titans. From 2014 to 2023, AerCap's EBITDA surged by approximately 52%, peaking in 2022, while Rockwell Automation's EBITDA grew steadily, reaching its zenith in 2023. AerCap's remarkable 2022 performance, with an EBITDA of nearly 7 billion, underscores its resilience and strategic prowess in the aviation sector. Meanwhile, Rockwell Automation's consistent growth trajectory highlights its robust position in industrial automation, culminating in a 37% increase over the decade. The data reveals a fascinating narrative of growth, adaptation, and market dynamics, offering insights into the strategic maneuvers of these industry leaders. As we look to the future, the missing data for 2024 invites speculation on how these companies will navigate the challenges and opportunities ahead.
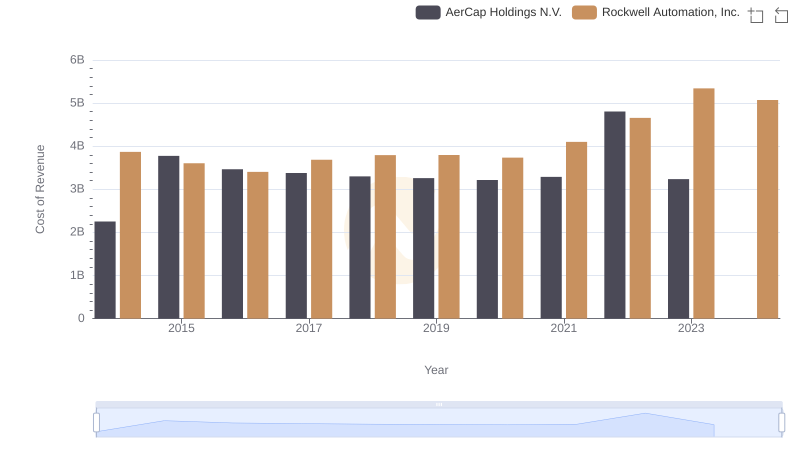
Analyzing Cost of Revenue: Rockwell Automation, Inc. and AerCap Holdings N.V.
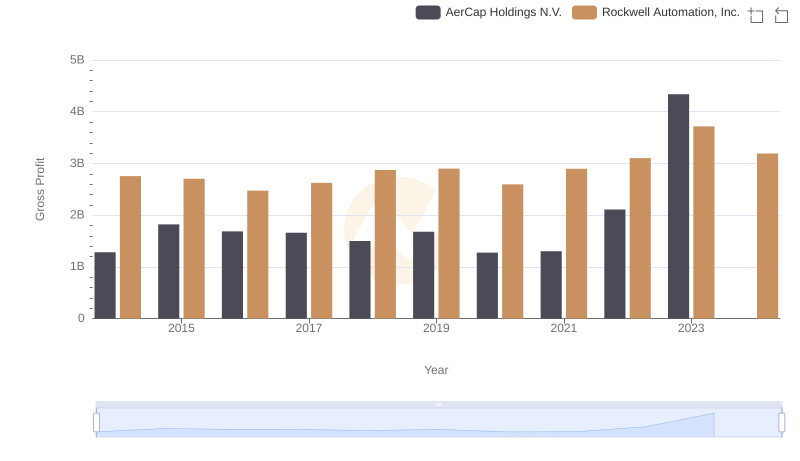
Gross Profit Comparison: Rockwell Automation, Inc. and AerCap Holdings N.V. Trends
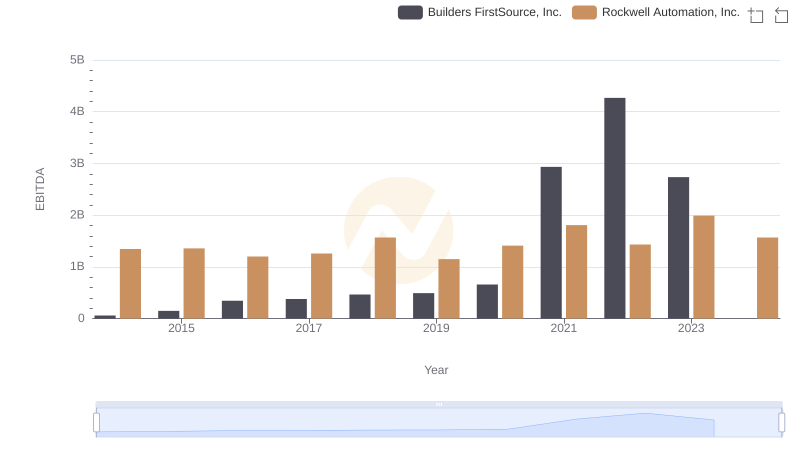
EBITDA Analysis: Evaluating Rockwell Automation, Inc. Against Builders FirstSource, Inc.
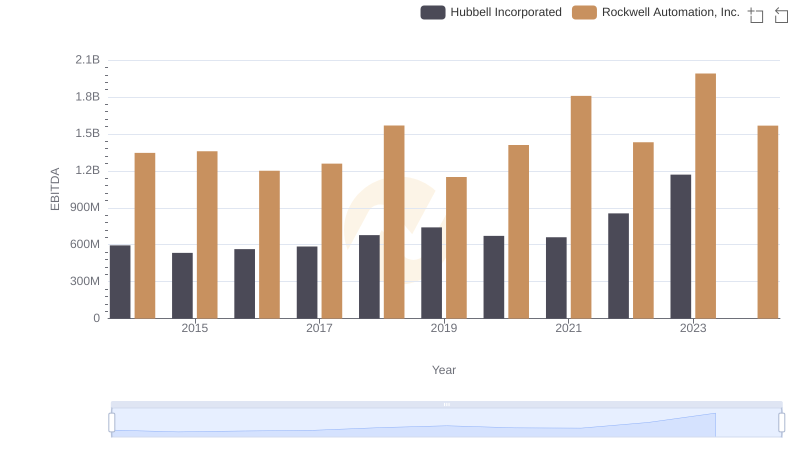
A Professional Review of EBITDA: Rockwell Automation, Inc. Compared to Hubbell Incorporated
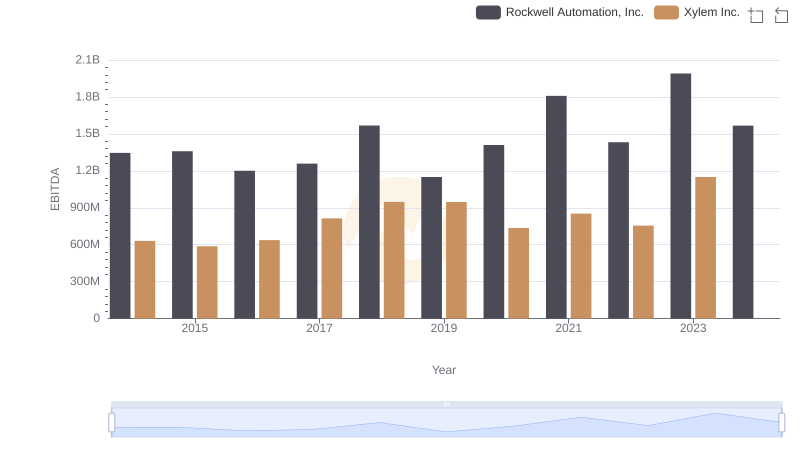
Professional EBITDA Benchmarking: Rockwell Automation, Inc. vs Xylem Inc.
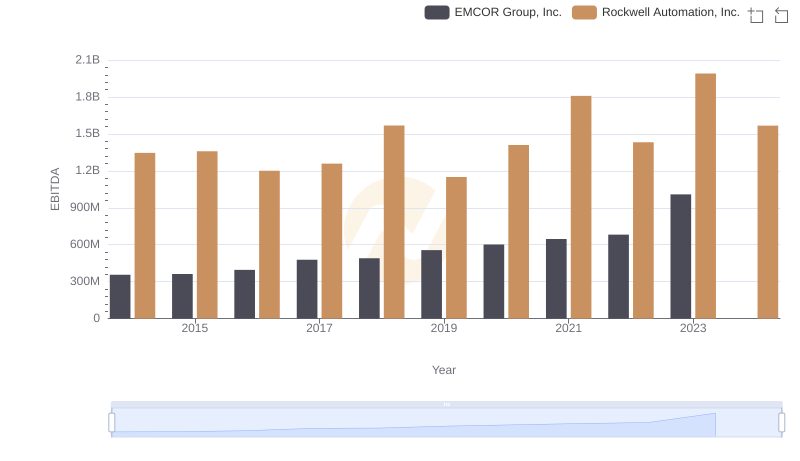
Rockwell Automation, Inc. and EMCOR Group, Inc.: A Detailed Examination of EBITDA Performance
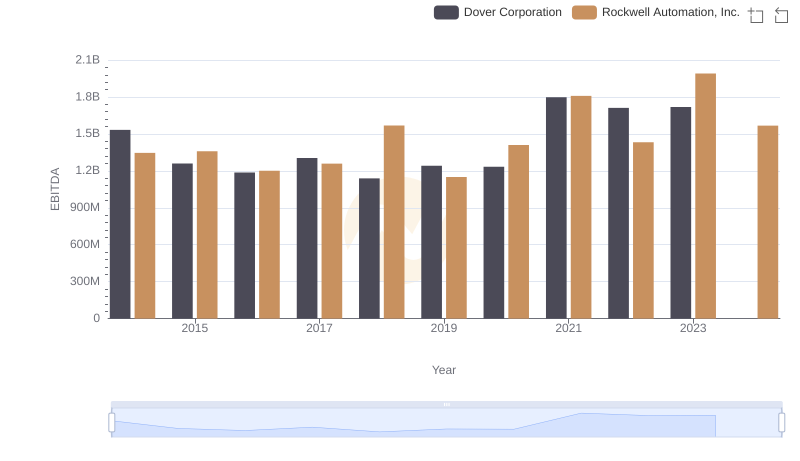
EBITDA Performance Review: Rockwell Automation, Inc. vs Dover Corporation
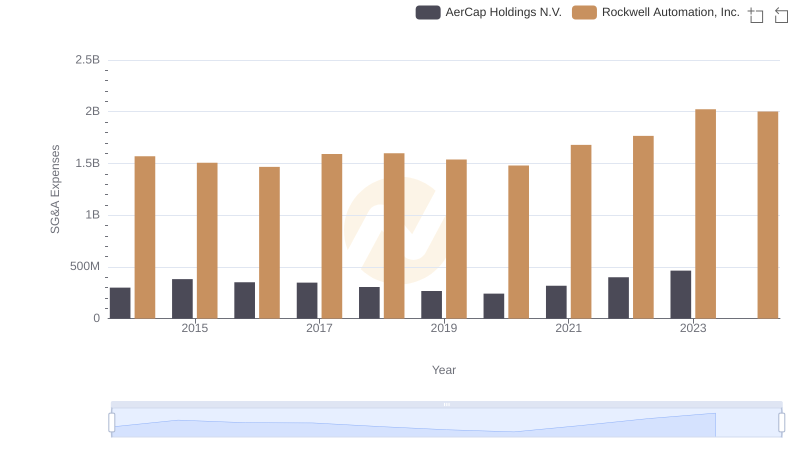
Rockwell Automation, Inc. or AerCap Holdings N.V.: Who Manages SG&A Costs Better?
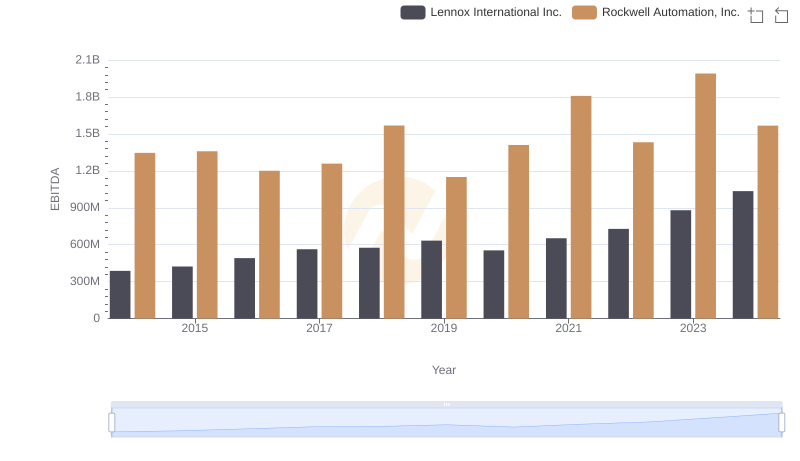
EBITDA Performance Review: Rockwell Automation, Inc. vs Lennox International Inc.
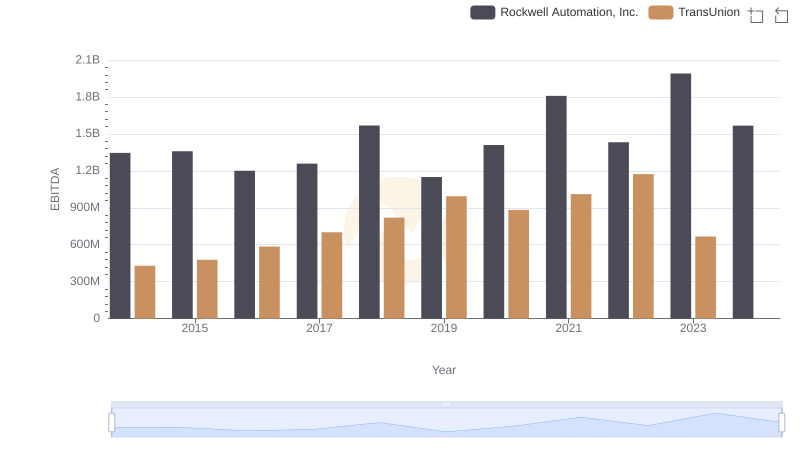
Comparative EBITDA Analysis: Rockwell Automation, Inc. vs TransUnion
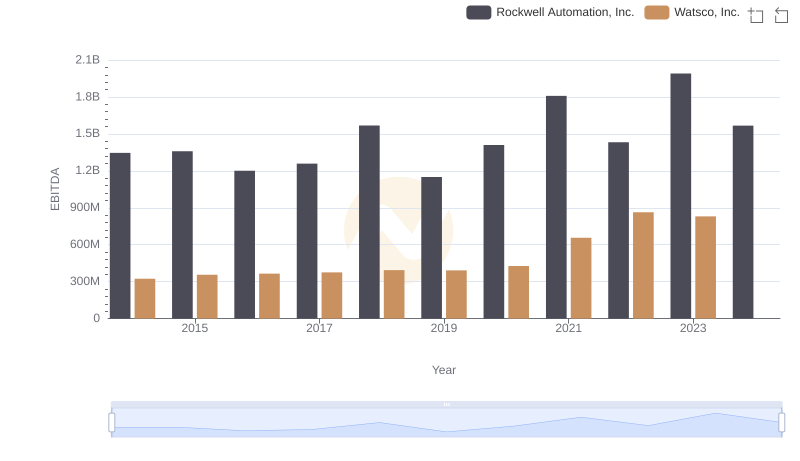
Comprehensive EBITDA Comparison: Rockwell Automation, Inc. vs Watsco, Inc.