| __timestamp | Lennox International Inc. | Rockwell Automation, Inc. |
|---|---|---|
| Wednesday, January 1, 2014 | 387700000 | 1346000000 |
| Thursday, January 1, 2015 | 423600000 | 1359100000 |
| Friday, January 1, 2016 | 490800000 | 1200700000 |
| Sunday, January 1, 2017 | 562900000 | 1258400000 |
| Monday, January 1, 2018 | 575200000 | 1568400000 |
| Tuesday, January 1, 2019 | 633300000 | 1150200000 |
| Wednesday, January 1, 2020 | 553900000 | 1410200000 |
| Friday, January 1, 2021 | 652500000 | 1808300000 |
| Saturday, January 1, 2022 | 729000000 | 1432100000 |
| Sunday, January 1, 2023 | 879500000 | 1990700000 |
| Monday, January 1, 2024 | 1034800000 | 1567500000 |
Unleashing insights
In the ever-evolving landscape of industrial automation and climate control, Rockwell Automation, Inc. and Lennox International Inc. have demonstrated remarkable EBITDA growth over the past decade. From 2014 to 2024, Rockwell Automation's EBITDA surged by approximately 16%, peaking in 2023 with a notable 1.99 billion. Meanwhile, Lennox International showcased an impressive 167% increase, reaching over 1 billion in 2024.
This comparative analysis highlights the dynamic nature of these industries and the strategic prowess of these leading companies.
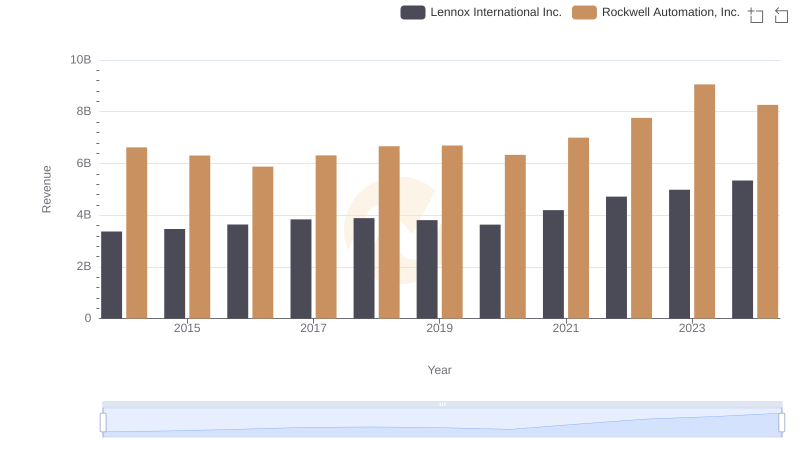
Revenue Insights: Rockwell Automation, Inc. and Lennox International Inc. Performance Compared
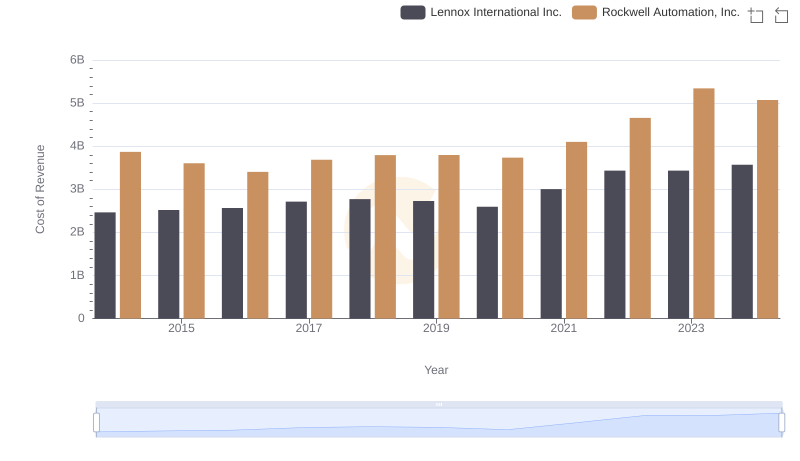
Cost of Revenue Trends: Rockwell Automation, Inc. vs Lennox International Inc.
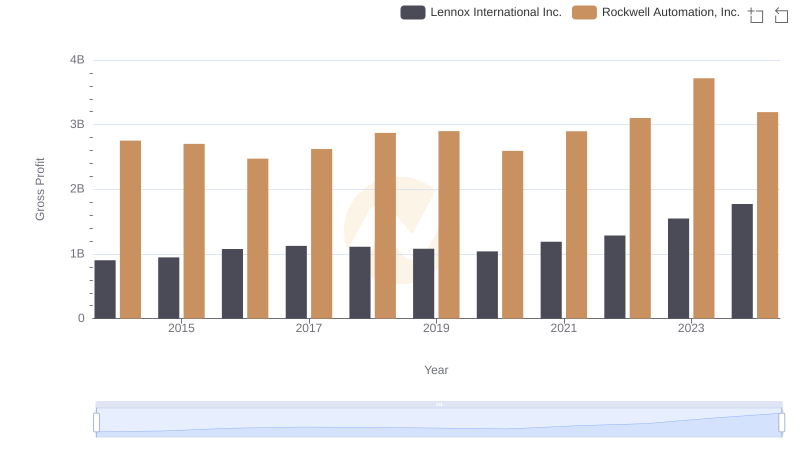
Rockwell Automation, Inc. vs Lennox International Inc.: A Gross Profit Performance Breakdown
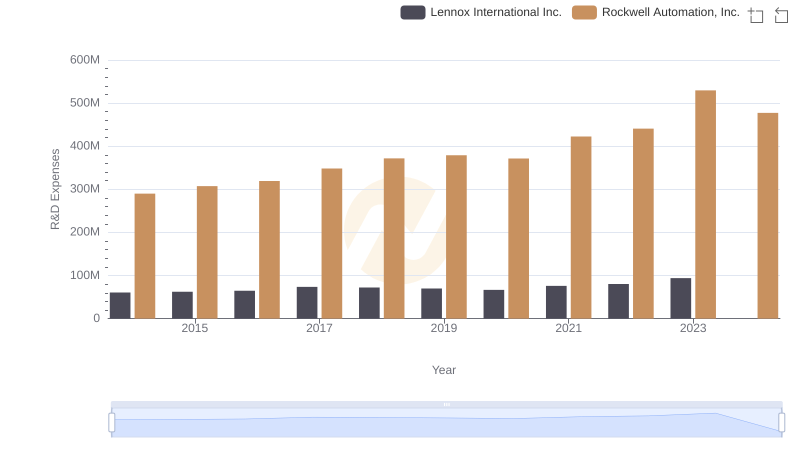
Rockwell Automation, Inc. or Lennox International Inc.: Who Invests More in Innovation?
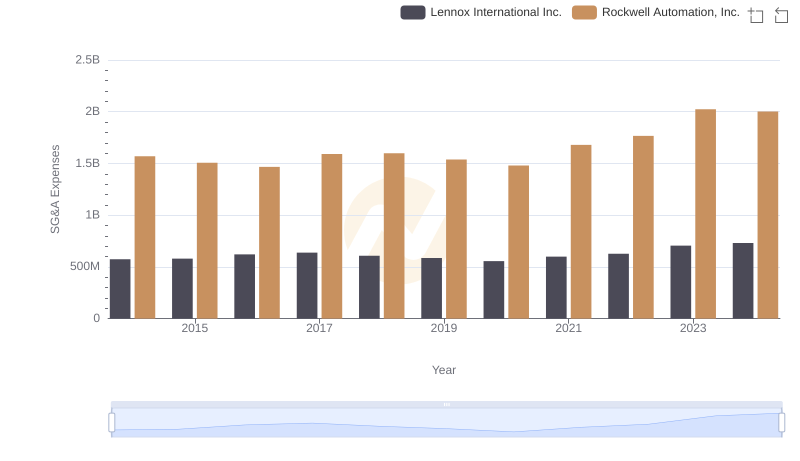
Cost Management Insights: SG&A Expenses for Rockwell Automation, Inc. and Lennox International Inc.
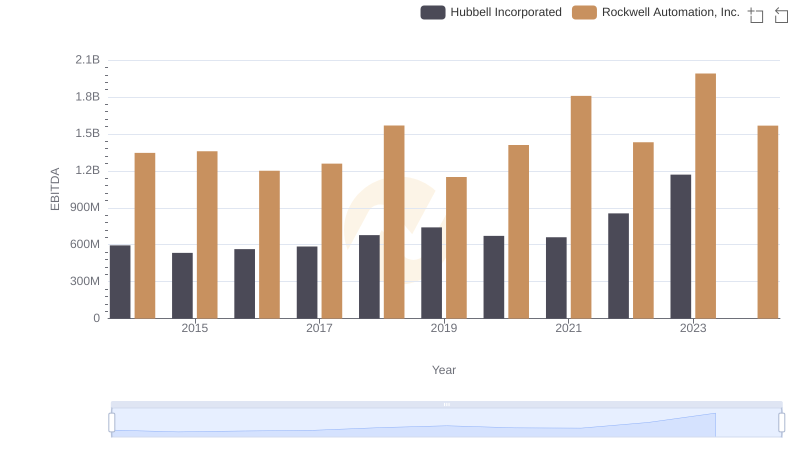
A Professional Review of EBITDA: Rockwell Automation, Inc. Compared to Hubbell Incorporated
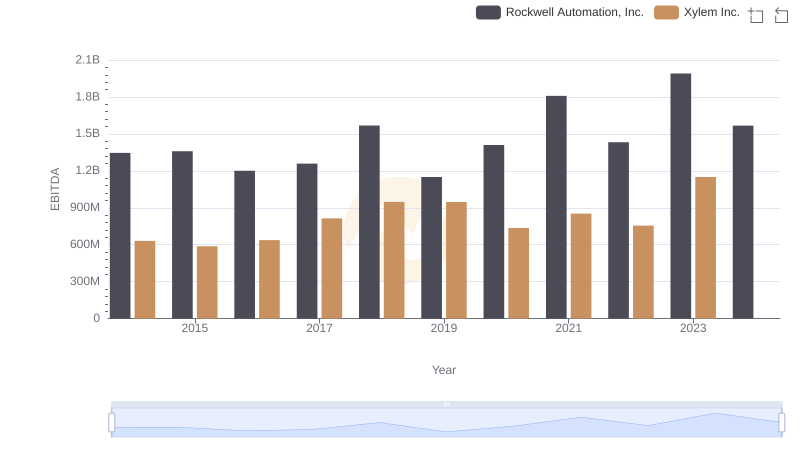
Professional EBITDA Benchmarking: Rockwell Automation, Inc. vs Xylem Inc.
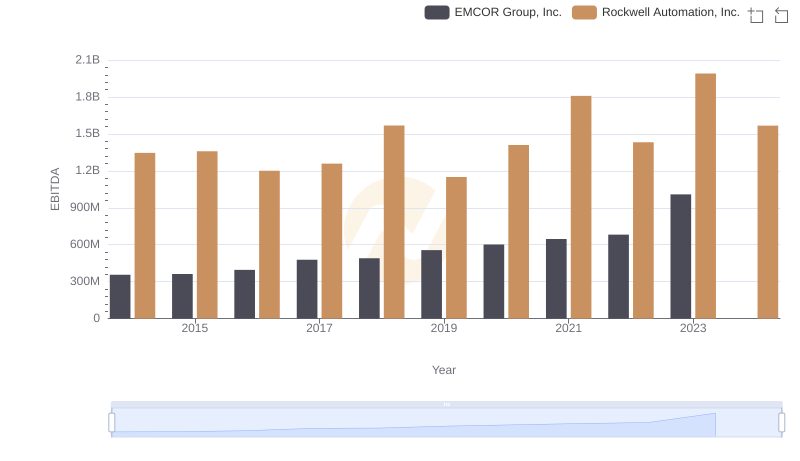
Rockwell Automation, Inc. and EMCOR Group, Inc.: A Detailed Examination of EBITDA Performance
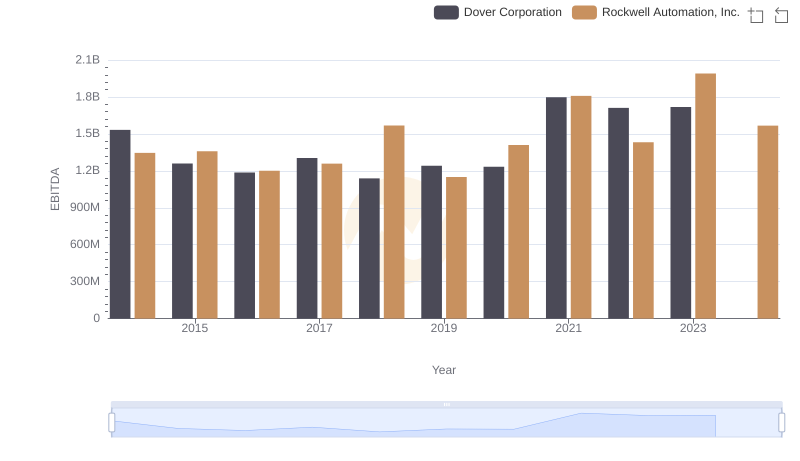
EBITDA Performance Review: Rockwell Automation, Inc. vs Dover Corporation
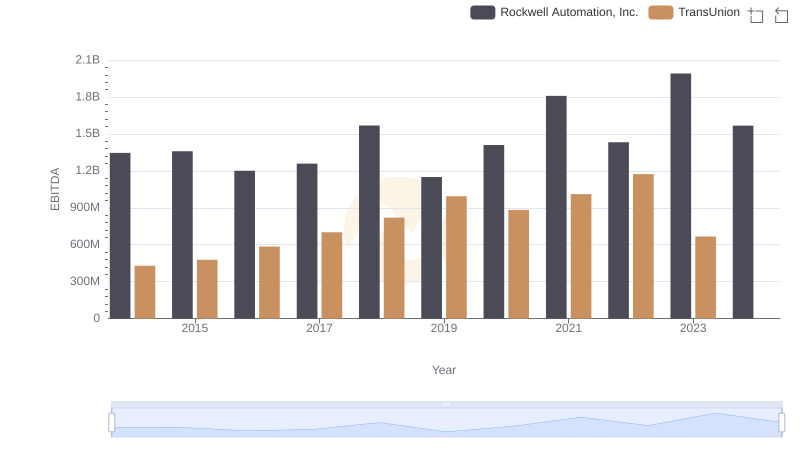
Comparative EBITDA Analysis: Rockwell Automation, Inc. vs TransUnion
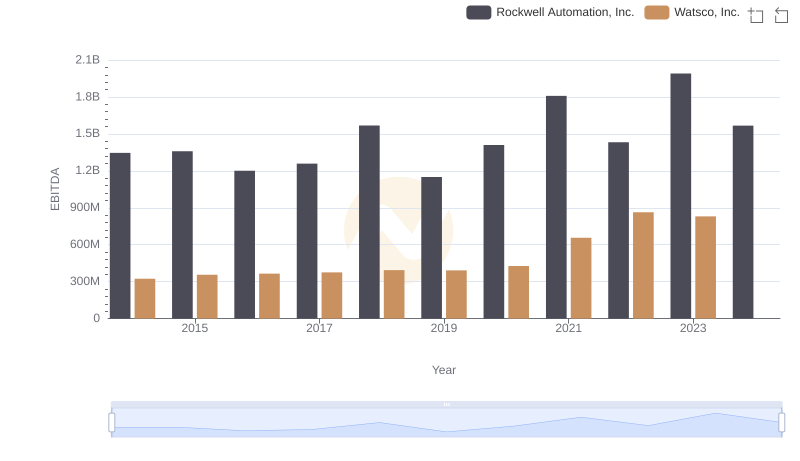
Comprehensive EBITDA Comparison: Rockwell Automation, Inc. vs Watsco, Inc.
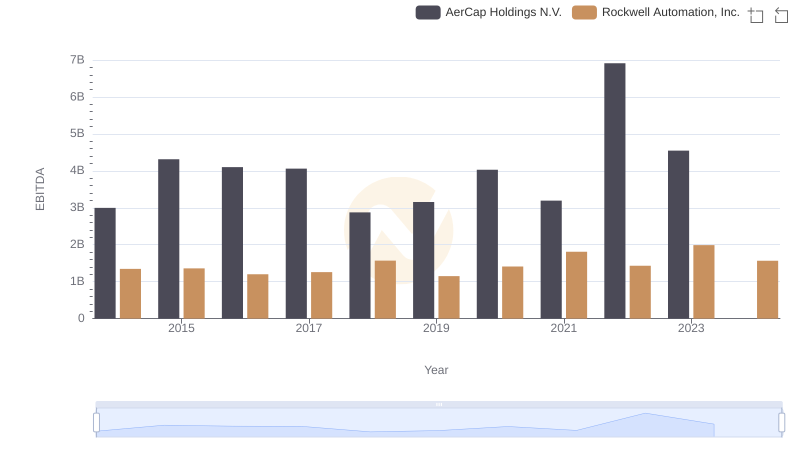
Comprehensive EBITDA Comparison: Rockwell Automation, Inc. vs AerCap Holdings N.V.