| __timestamp | Rockwell Automation, Inc. | Watsco, Inc. |
|---|---|---|
| Wednesday, January 1, 2014 | 1346000000 | 323674000 |
| Thursday, January 1, 2015 | 1359100000 | 355865000 |
| Friday, January 1, 2016 | 1200700000 | 365698000 |
| Sunday, January 1, 2017 | 1258400000 | 375907000 |
| Monday, January 1, 2018 | 1568400000 | 394177000 |
| Tuesday, January 1, 2019 | 1150200000 | 391396000 |
| Wednesday, January 1, 2020 | 1410200000 | 426942000 |
| Friday, January 1, 2021 | 1808300000 | 656655000 |
| Saturday, January 1, 2022 | 1432100000 | 863261000 |
| Sunday, January 1, 2023 | 1990700000 | 829900000 |
| Monday, January 1, 2024 | 1567500000 | 781775000 |
Igniting the spark of knowledge
In the ever-evolving landscape of industrial automation and HVAC distribution, Rockwell Automation and Watsco have emerged as key players. Over the past decade, Rockwell Automation has consistently outperformed Watsco in terms of EBITDA, showcasing a robust growth trajectory. From 2014 to 2023, Rockwell's EBITDA surged by approximately 48%, peaking in 2023. In contrast, Watsco's EBITDA, while showing a commendable increase of around 156% from 2014 to 2022, experienced a slight dip in 2023. This comparison highlights Rockwell's resilience and strategic prowess in maintaining a steady upward trend, even amidst market fluctuations. Notably, the data for 2024 is incomplete, leaving room for speculation on future performance. As these industry giants continue to innovate, stakeholders and investors keenly watch their financial health, making EBITDA a critical metric for assessing operational efficiency and profitability.
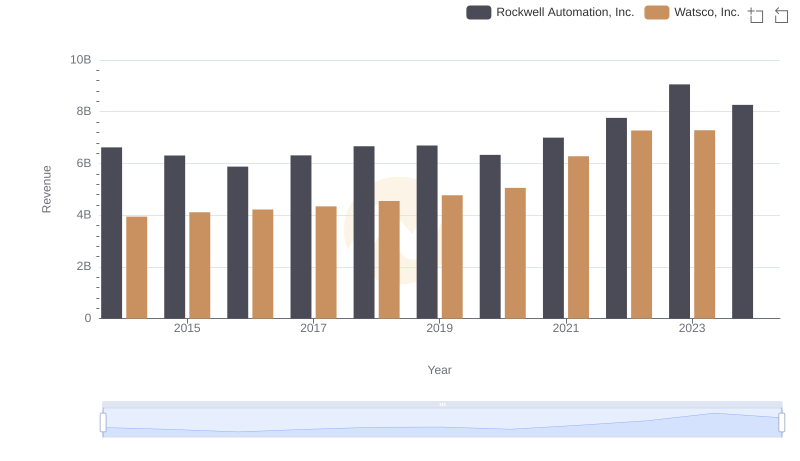
Annual Revenue Comparison: Rockwell Automation, Inc. vs Watsco, Inc.
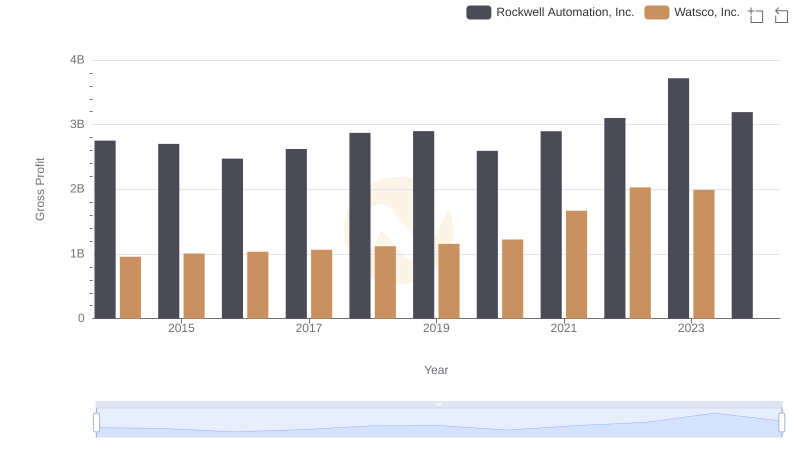
Rockwell Automation, Inc. vs Watsco, Inc.: A Gross Profit Performance Breakdown
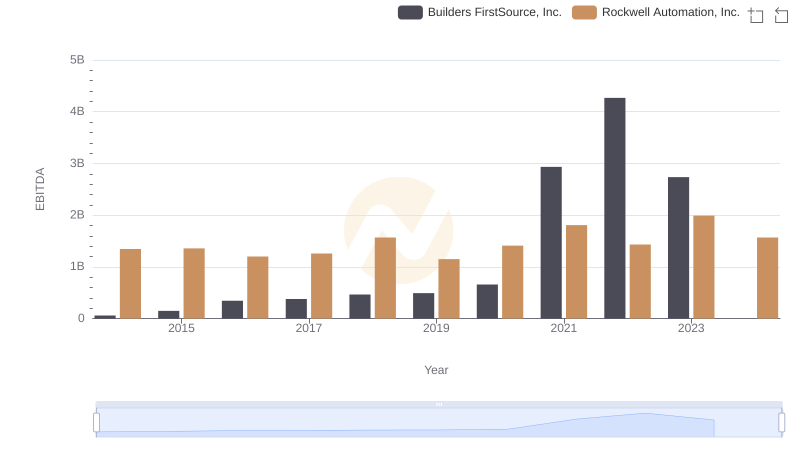
EBITDA Analysis: Evaluating Rockwell Automation, Inc. Against Builders FirstSource, Inc.
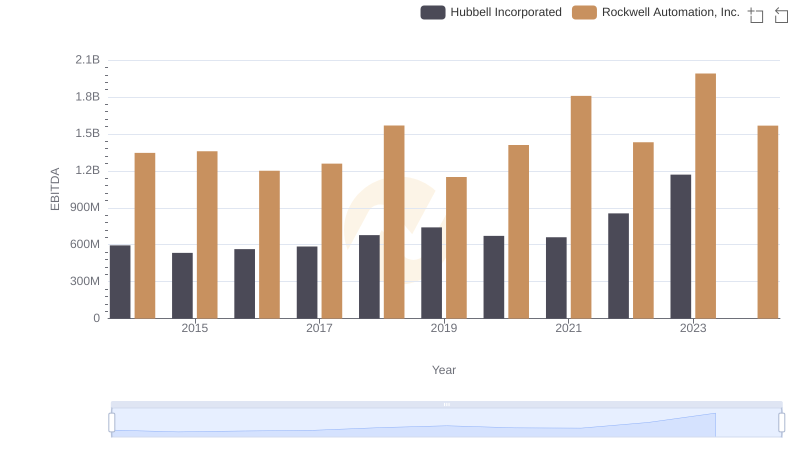
A Professional Review of EBITDA: Rockwell Automation, Inc. Compared to Hubbell Incorporated
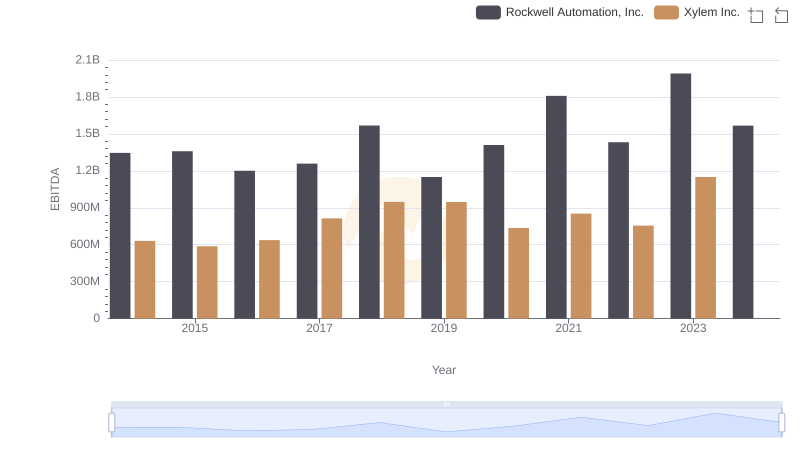
Professional EBITDA Benchmarking: Rockwell Automation, Inc. vs Xylem Inc.
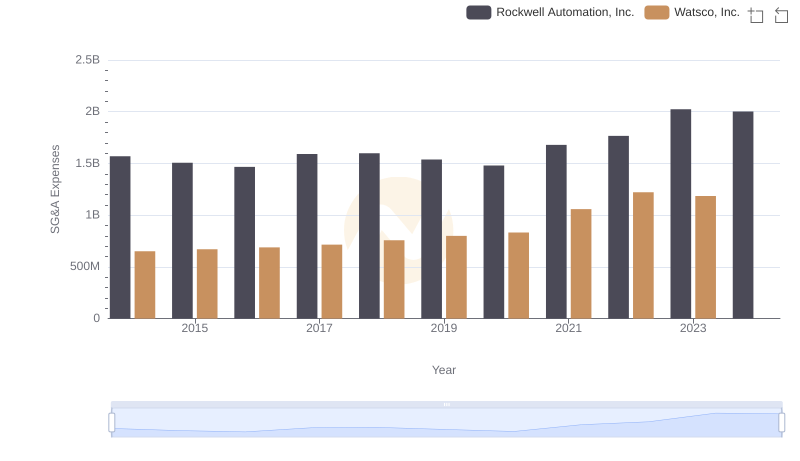
Operational Costs Compared: SG&A Analysis of Rockwell Automation, Inc. and Watsco, Inc.
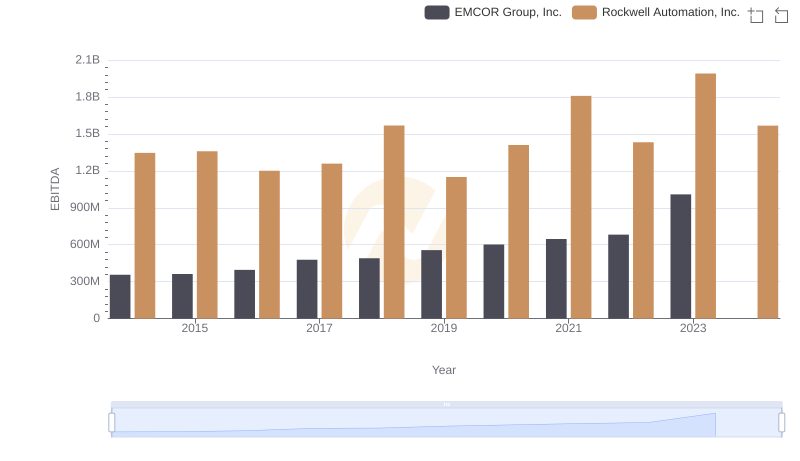
Rockwell Automation, Inc. and EMCOR Group, Inc.: A Detailed Examination of EBITDA Performance
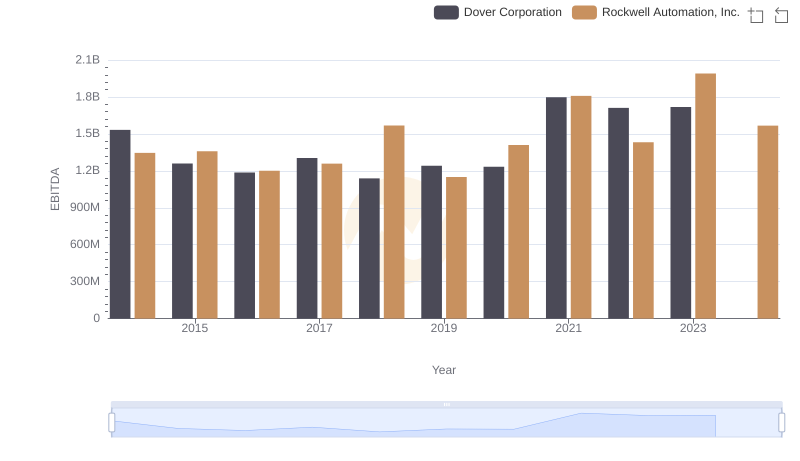
EBITDA Performance Review: Rockwell Automation, Inc. vs Dover Corporation
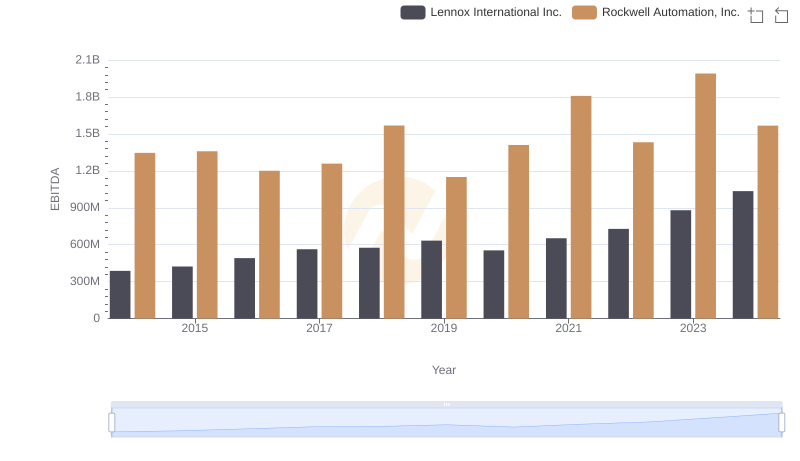
EBITDA Performance Review: Rockwell Automation, Inc. vs Lennox International Inc.
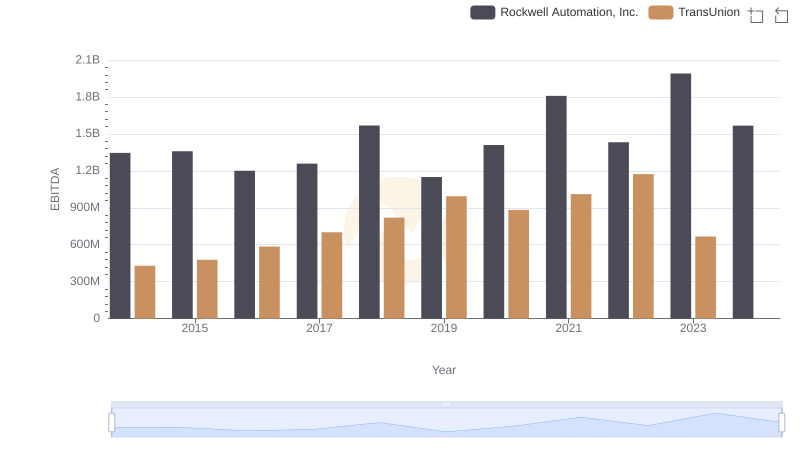
Comparative EBITDA Analysis: Rockwell Automation, Inc. vs TransUnion
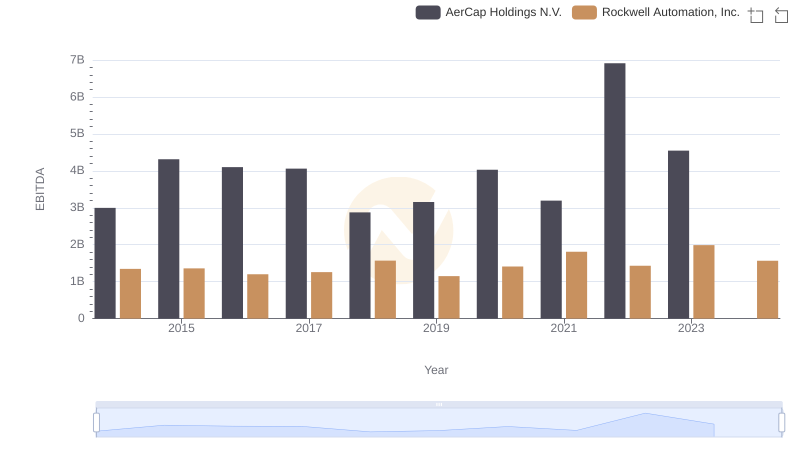
Comprehensive EBITDA Comparison: Rockwell Automation, Inc. vs AerCap Holdings N.V.