| __timestamp | Hubbell Incorporated | Rockwell Automation, Inc. |
|---|---|---|
| Wednesday, January 1, 2014 | 594700000 | 1346000000 |
| Thursday, January 1, 2015 | 533600000 | 1359100000 |
| Friday, January 1, 2016 | 564700000 | 1200700000 |
| Sunday, January 1, 2017 | 585600000 | 1258400000 |
| Monday, January 1, 2018 | 677500000 | 1568400000 |
| Tuesday, January 1, 2019 | 740900000 | 1150200000 |
| Wednesday, January 1, 2020 | 671400000 | 1410200000 |
| Friday, January 1, 2021 | 661000000 | 1808300000 |
| Saturday, January 1, 2022 | 854300000 | 1432100000 |
| Sunday, January 1, 2023 | 1169700000 | 1990700000 |
| Monday, January 1, 2024 | 1291200000 | 1567500000 |
In pursuit of knowledge
In the ever-evolving landscape of industrial automation and electrical products, Rockwell Automation and Hubbell Incorporated stand as titans. Over the past decade, Rockwell Automation has consistently outperformed Hubbell in terms of EBITDA, showcasing a robust growth trajectory. From 2014 to 2023, Rockwell's EBITDA surged by approximately 48%, peaking in 2023. In contrast, Hubbell's EBITDA, while showing a commendable 97% increase, still trails behind Rockwell's figures. Notably, 2023 marked a significant year for both companies, with Rockwell reaching its highest EBITDA, while Hubbell also achieved a record high. However, data for 2024 is incomplete, leaving room for speculation on future trends. This analysis underscores the dynamic nature of the industry and the strategic maneuvers by these companies to maintain their competitive edge.
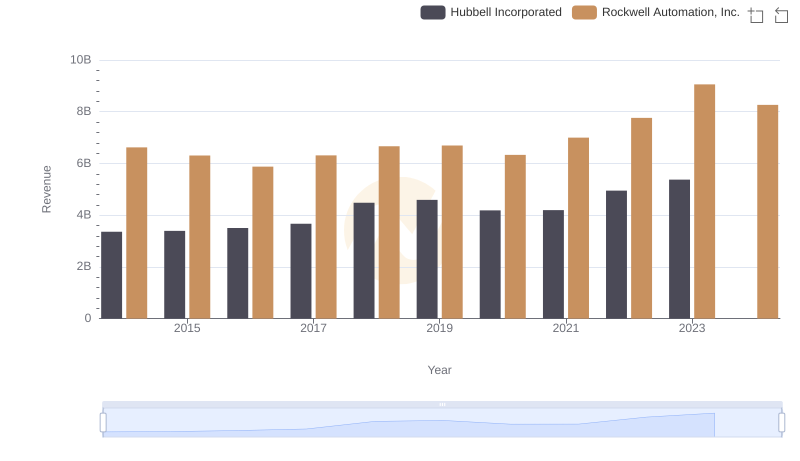
Revenue Showdown: Rockwell Automation, Inc. vs Hubbell Incorporated

Key Insights on Gross Profit: Rockwell Automation, Inc. vs Hubbell Incorporated
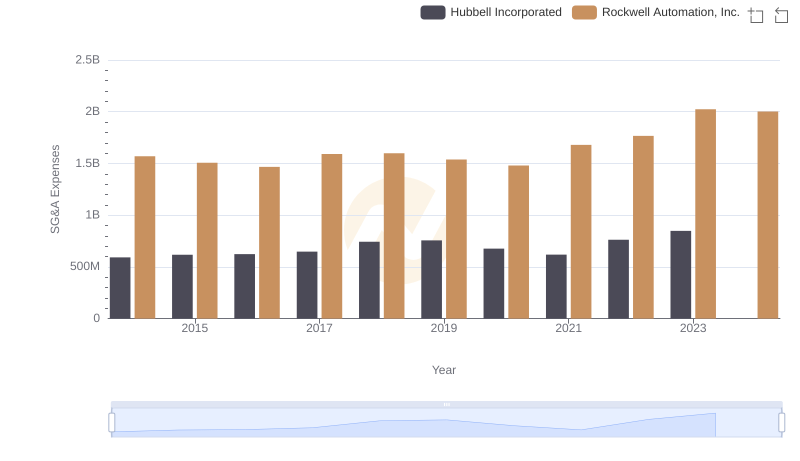
Operational Costs Compared: SG&A Analysis of Rockwell Automation, Inc. and Hubbell Incorporated
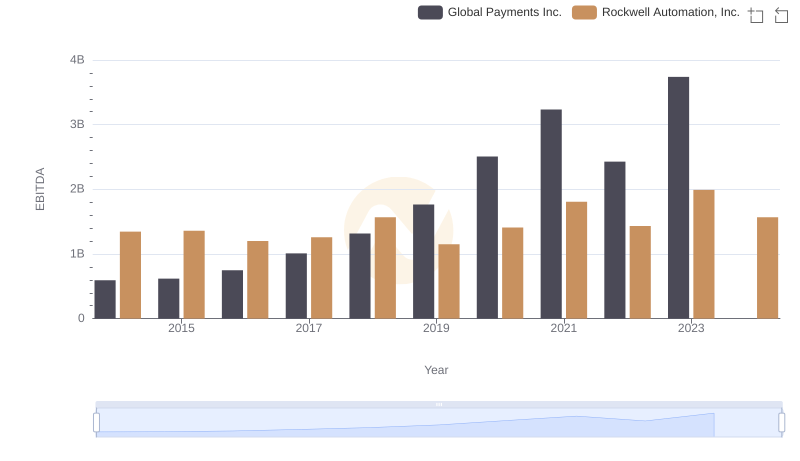
Rockwell Automation, Inc. vs Global Payments Inc.: In-Depth EBITDA Performance Comparison
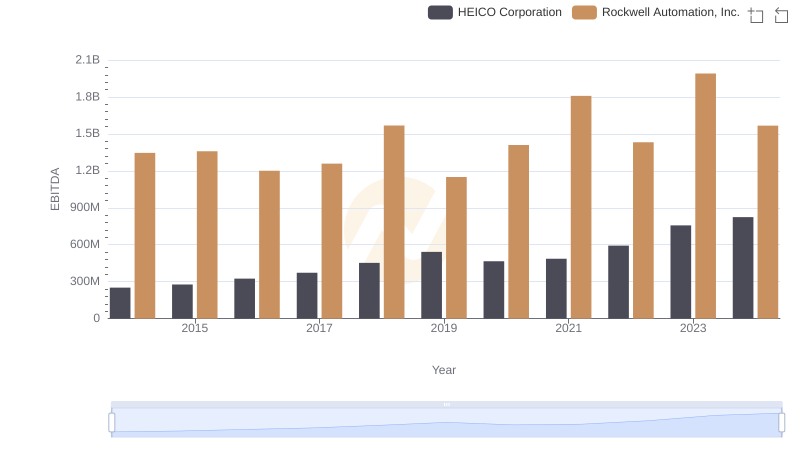
EBITDA Analysis: Evaluating Rockwell Automation, Inc. Against HEICO Corporation
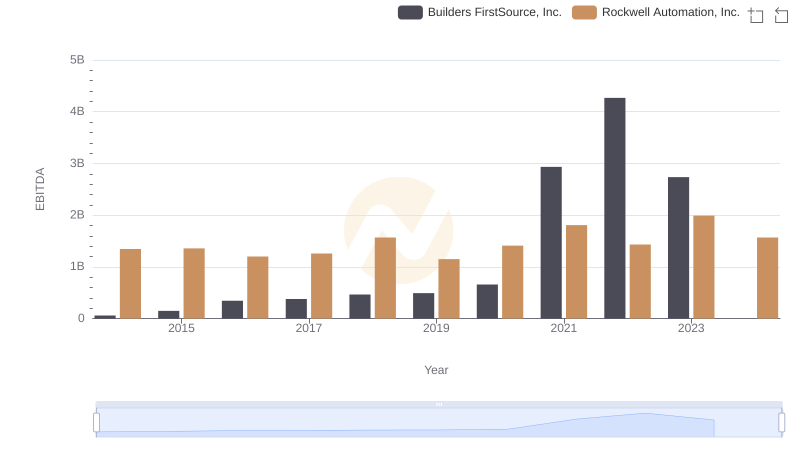
EBITDA Analysis: Evaluating Rockwell Automation, Inc. Against Builders FirstSource, Inc.
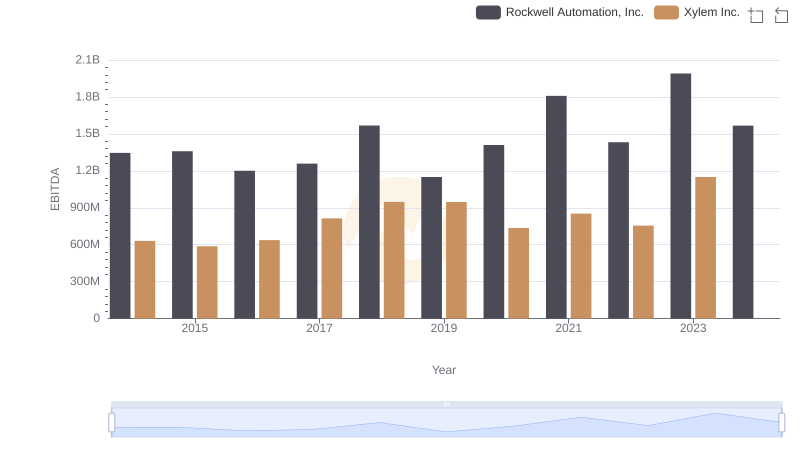
Professional EBITDA Benchmarking: Rockwell Automation, Inc. vs Xylem Inc.
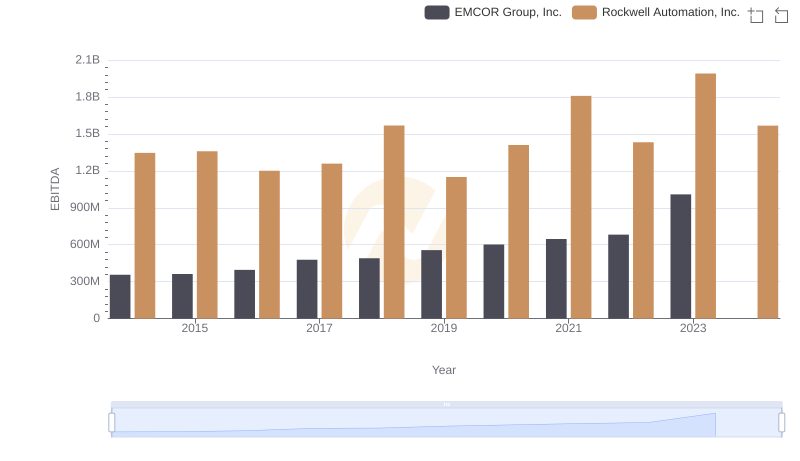
Rockwell Automation, Inc. and EMCOR Group, Inc.: A Detailed Examination of EBITDA Performance
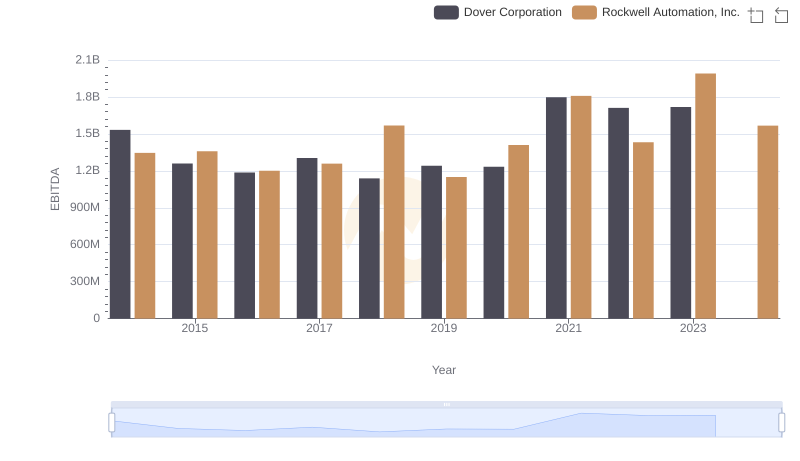
EBITDA Performance Review: Rockwell Automation, Inc. vs Dover Corporation
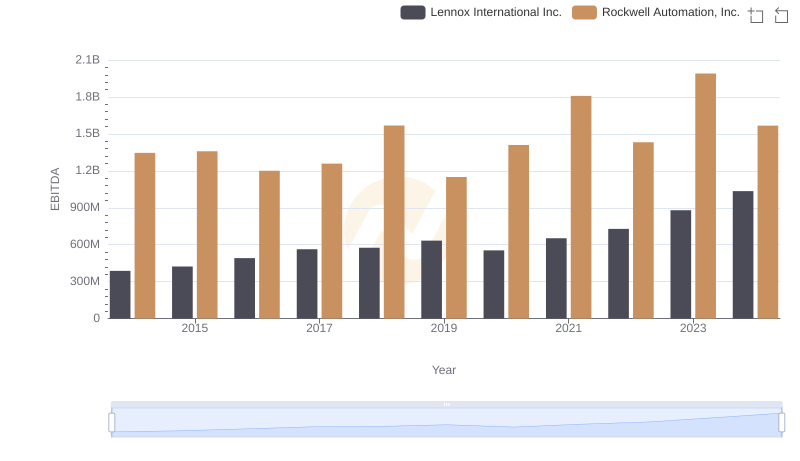
EBITDA Performance Review: Rockwell Automation, Inc. vs Lennox International Inc.
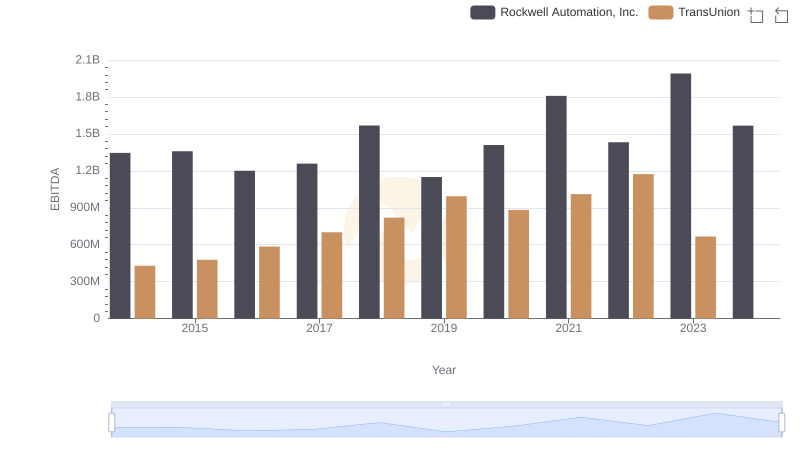
Comparative EBITDA Analysis: Rockwell Automation, Inc. vs TransUnion