| __timestamp | AerCap Holdings N.V. | Rockwell Automation, Inc. |
|---|---|---|
| Wednesday, January 1, 2014 | 1282919000 | 2753900000 |
| Thursday, January 1, 2015 | 1822255000 | 2703100000 |
| Friday, January 1, 2016 | 1686404000 | 2475500000 |
| Sunday, January 1, 2017 | 1660054000 | 2624200000 |
| Monday, January 1, 2018 | 1500345000 | 2872200000 |
| Tuesday, January 1, 2019 | 1678249000 | 2900100000 |
| Wednesday, January 1, 2020 | 1276496000 | 2595200000 |
| Friday, January 1, 2021 | 1301517000 | 2897700000 |
| Saturday, January 1, 2022 | 2109708000 | 3102000000 |
| Sunday, January 1, 2023 | 4337648000 | 3717000000 |
| Monday, January 1, 2024 | 3193400000 |
Igniting the spark of knowledge
In the ever-evolving landscape of industrial automation and aviation leasing, Rockwell Automation, Inc. and AerCap Holdings N.V. have emerged as formidable players. Over the past decade, Rockwell Automation has consistently demonstrated robust growth, with its gross profit peaking at approximately $3.7 billion in 2023, marking a 35% increase from 2014. Meanwhile, AerCap Holdings has shown remarkable resilience, especially in 2023, where its gross profit surged to over $4.3 billion, a staggering 238% rise from its 2014 figures.
While Rockwell Automation's growth has been steady, AerCap's recent leap highlights its strategic prowess in navigating the complexities of the aviation sector. However, data for 2024 remains incomplete, leaving room for speculation on future trends. As these industry titans continue to innovate, their financial trajectories offer valuable insights into their strategic directions.

Key Insights on Gross Profit: Rockwell Automation, Inc. vs Hubbell Incorporated
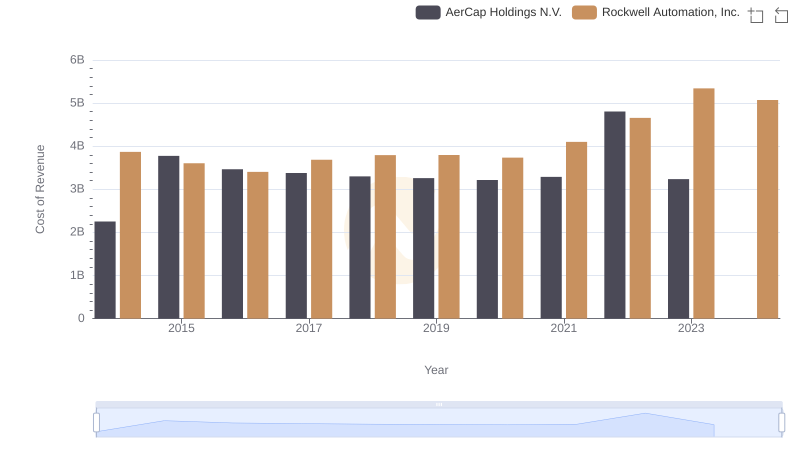
Analyzing Cost of Revenue: Rockwell Automation, Inc. and AerCap Holdings N.V.
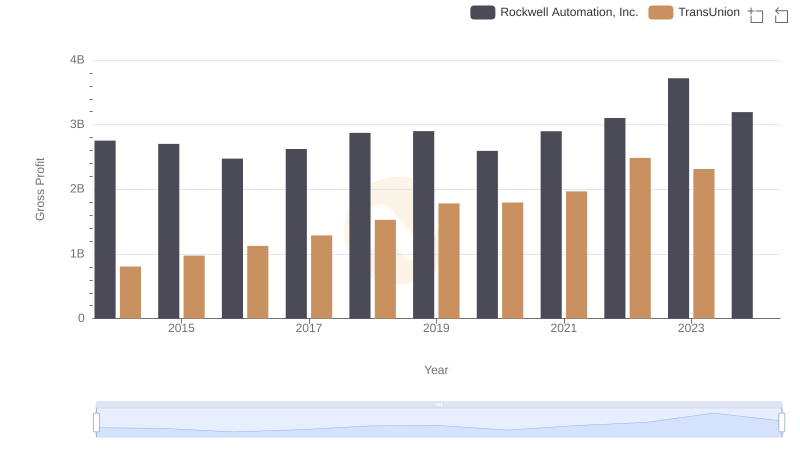
Rockwell Automation, Inc. and TransUnion: A Detailed Gross Profit Analysis
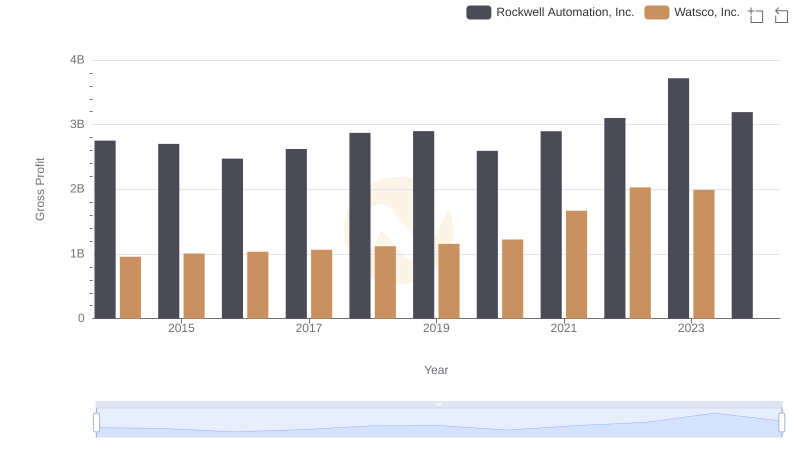
Rockwell Automation, Inc. vs Watsco, Inc.: A Gross Profit Performance Breakdown
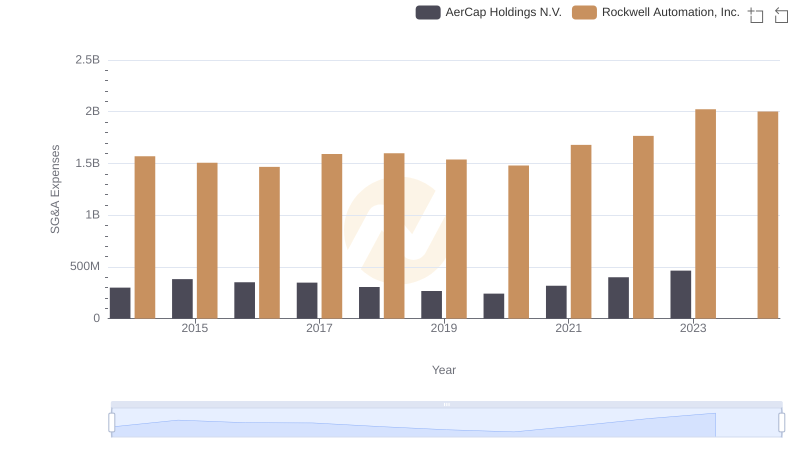
Rockwell Automation, Inc. or AerCap Holdings N.V.: Who Manages SG&A Costs Better?
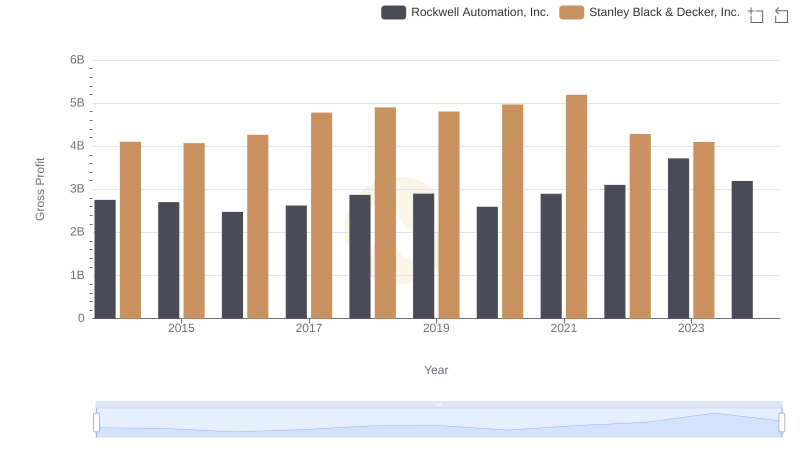
Who Generates Higher Gross Profit? Rockwell Automation, Inc. or Stanley Black & Decker, Inc.
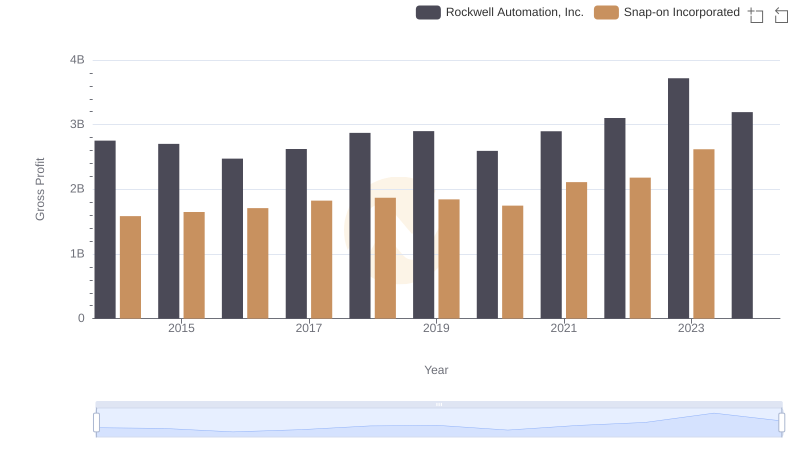
Who Generates Higher Gross Profit? Rockwell Automation, Inc. or Snap-on Incorporated
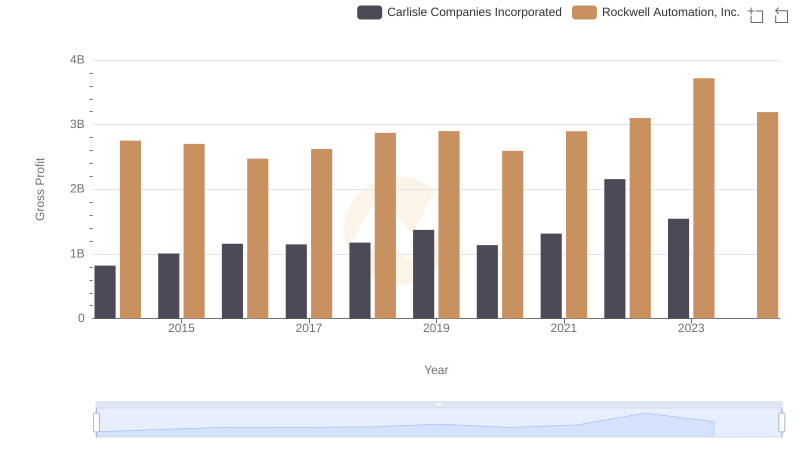
Gross Profit Analysis: Comparing Rockwell Automation, Inc. and Carlisle Companies Incorporated
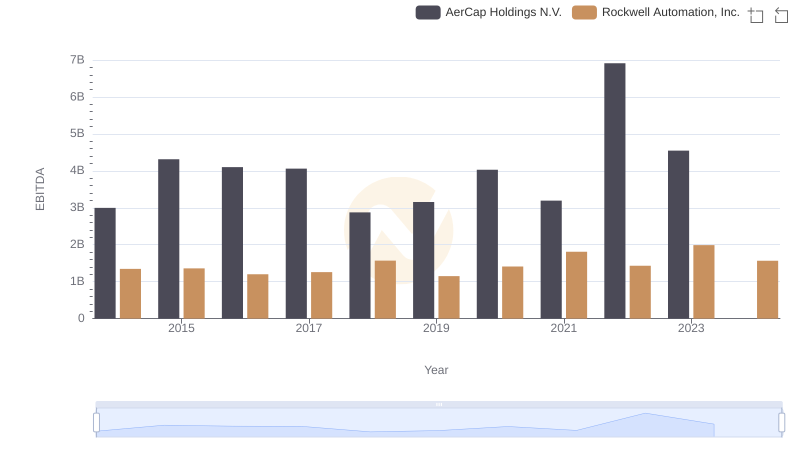
Comprehensive EBITDA Comparison: Rockwell Automation, Inc. vs AerCap Holdings N.V.