| __timestamp | EMCOR Group, Inc. | Rockwell Automation, Inc. |
|---|---|---|
| Wednesday, January 1, 2014 | 355858000 | 1346000000 |
| Thursday, January 1, 2015 | 362095000 | 1359100000 |
| Friday, January 1, 2016 | 395913000 | 1200700000 |
| Sunday, January 1, 2017 | 478459000 | 1258400000 |
| Monday, January 1, 2018 | 489954000 | 1568400000 |
| Tuesday, January 1, 2019 | 556055000 | 1150200000 |
| Wednesday, January 1, 2020 | 601449000 | 1410200000 |
| Friday, January 1, 2021 | 646861000 | 1808300000 |
| Saturday, January 1, 2022 | 682399000 | 1432100000 |
| Sunday, January 1, 2023 | 1009017000 | 1990700000 |
| Monday, January 1, 2024 | 1567500000 |
Unleashing insights
In the ever-evolving landscape of industrial automation and construction services, Rockwell Automation, Inc. and EMCOR Group, Inc. have emerged as key players. Over the past decade, Rockwell Automation has consistently outperformed EMCOR in terms of EBITDA, showcasing a robust growth trajectory. From 2014 to 2023, Rockwell's EBITDA surged by approximately 48%, peaking in 2023. In contrast, EMCOR's EBITDA, while showing a commendable 183% increase, reflects a more volatile journey, with a significant leap in 2023. This disparity highlights Rockwell's steady market dominance and strategic prowess. However, the absence of EMCOR's 2024 data suggests potential challenges or strategic shifts. As industries pivot towards digital transformation, these financial insights underscore the importance of strategic agility and innovation in maintaining competitive advantage.
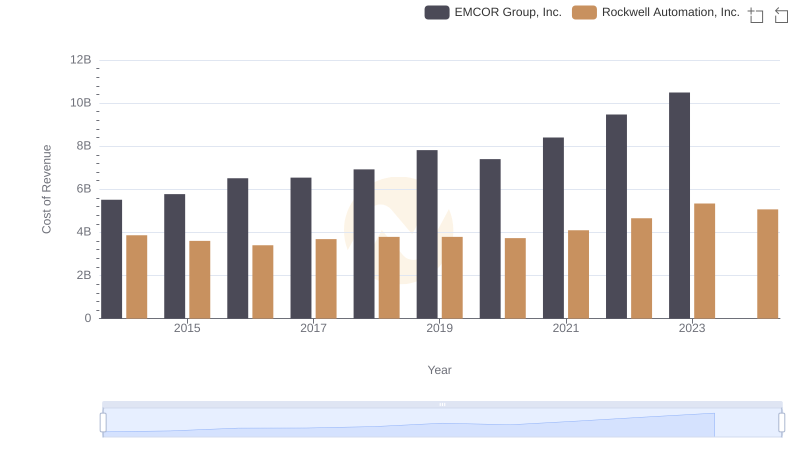
Cost of Revenue Comparison: Rockwell Automation, Inc. vs EMCOR Group, Inc.
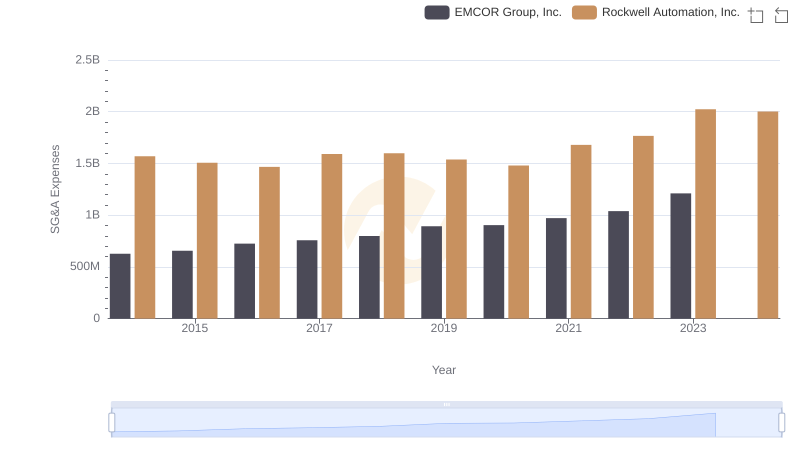
Comparing SG&A Expenses: Rockwell Automation, Inc. vs EMCOR Group, Inc. Trends and Insights
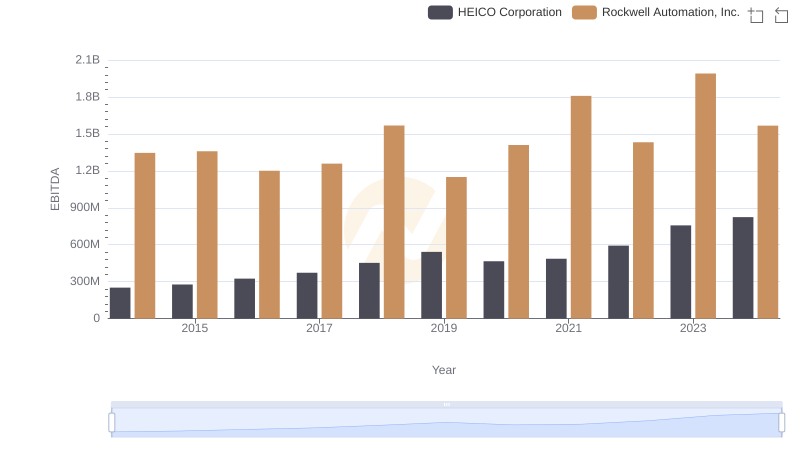
EBITDA Analysis: Evaluating Rockwell Automation, Inc. Against HEICO Corporation
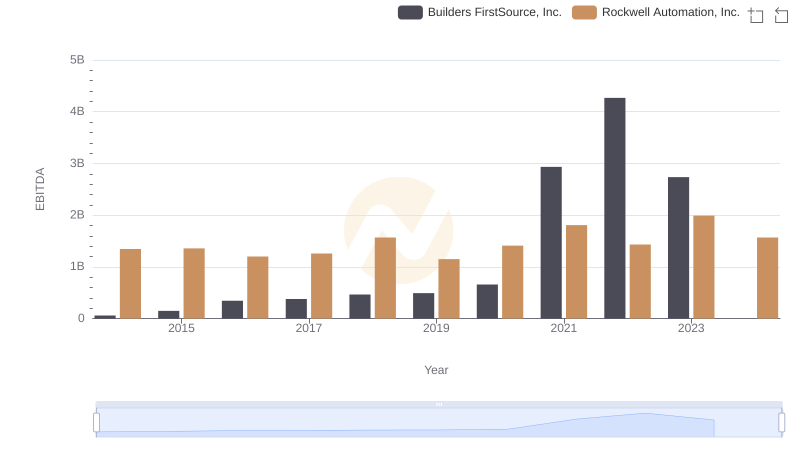
EBITDA Analysis: Evaluating Rockwell Automation, Inc. Against Builders FirstSource, Inc.
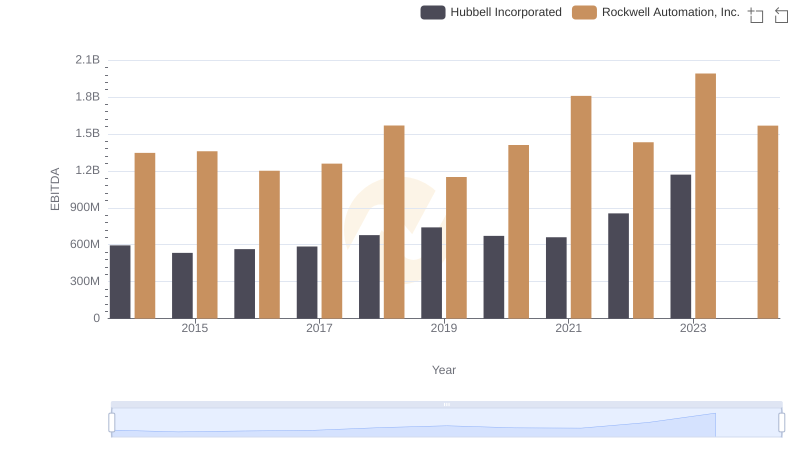
A Professional Review of EBITDA: Rockwell Automation, Inc. Compared to Hubbell Incorporated
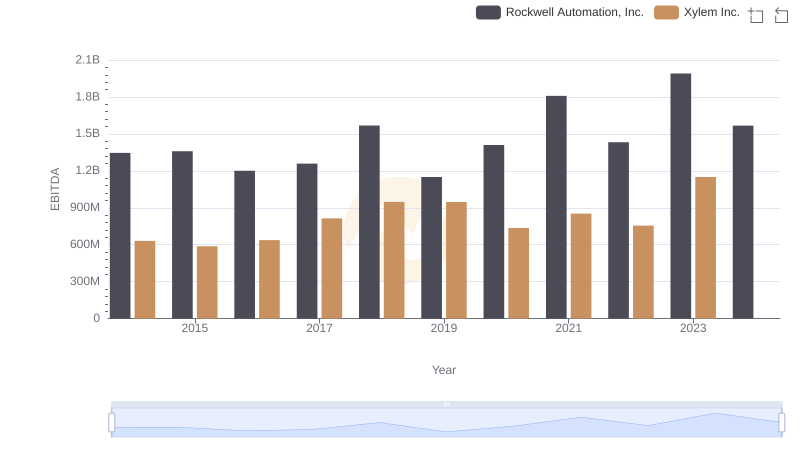
Professional EBITDA Benchmarking: Rockwell Automation, Inc. vs Xylem Inc.
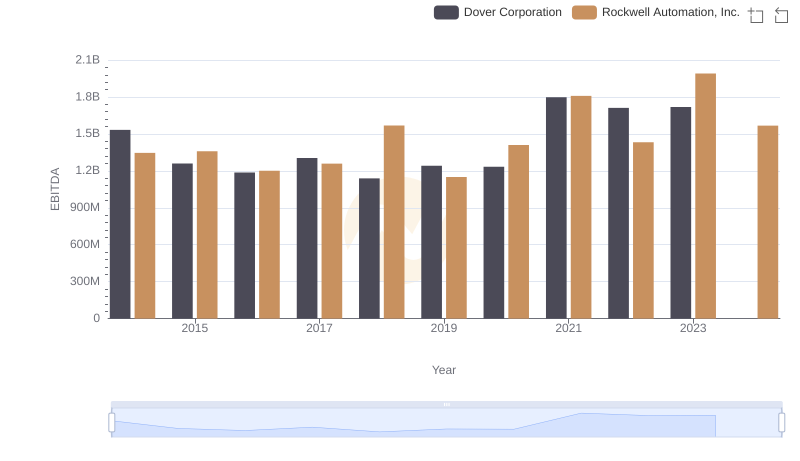
EBITDA Performance Review: Rockwell Automation, Inc. vs Dover Corporation
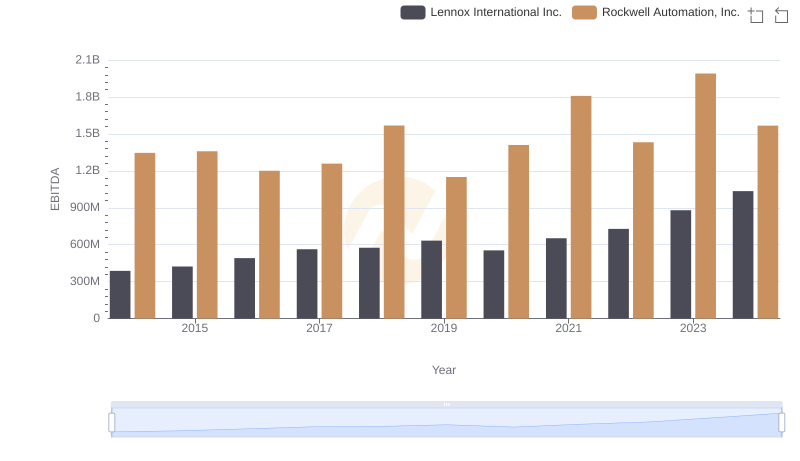
EBITDA Performance Review: Rockwell Automation, Inc. vs Lennox International Inc.
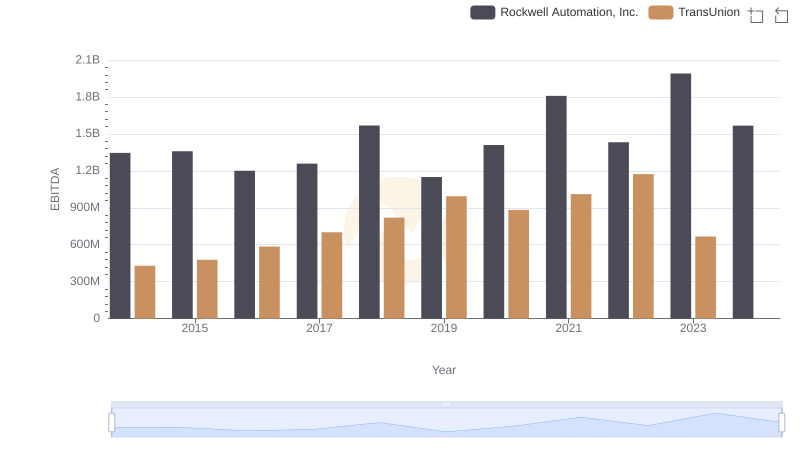
Comparative EBITDA Analysis: Rockwell Automation, Inc. vs TransUnion
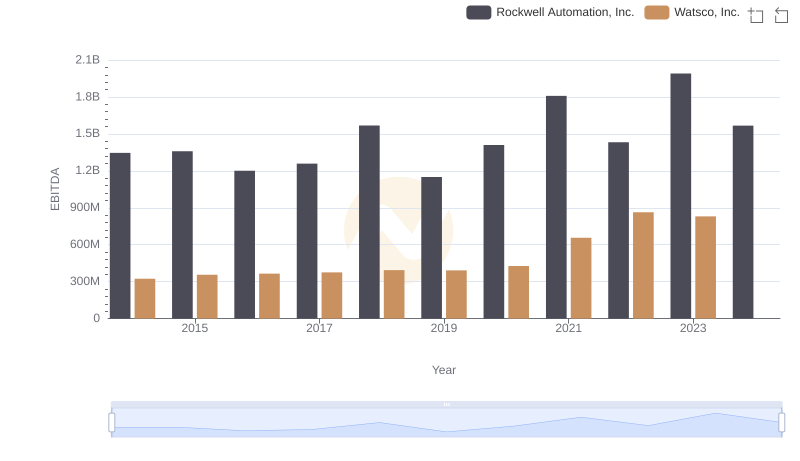
Comprehensive EBITDA Comparison: Rockwell Automation, Inc. vs Watsco, Inc.