| __timestamp | Rockwell Automation, Inc. | Xylem Inc. |
|---|---|---|
| Wednesday, January 1, 2014 | 1346000000 | 631000000 |
| Thursday, January 1, 2015 | 1359100000 | 588000000 |
| Friday, January 1, 2016 | 1200700000 | 637000000 |
| Sunday, January 1, 2017 | 1258400000 | 814000000 |
| Monday, January 1, 2018 | 1568400000 | 948000000 |
| Tuesday, January 1, 2019 | 1150200000 | 947000000 |
| Wednesday, January 1, 2020 | 1410200000 | 736000000 |
| Friday, January 1, 2021 | 1808300000 | 853000000 |
| Saturday, January 1, 2022 | 1432100000 | 755000000 |
| Sunday, January 1, 2023 | 1990700000 | 1150000000 |
| Monday, January 1, 2024 | 1567500000 |
Igniting the spark of knowledge
In the competitive landscape of industrial automation and water technology, Rockwell Automation, Inc. and Xylem Inc. have shown distinct financial trajectories over the past decade. From 2014 to 2023, Rockwell Automation's EBITDA has seen a robust growth of approximately 48%, peaking in 2023. This reflects the company's strategic advancements and market adaptability. In contrast, Xylem Inc. has experienced a more modest increase of around 82% in the same period, with a notable surge in 2023, indicating its expanding influence in the water technology sector.
The data reveals a consistent upward trend for both companies, with Rockwell Automation maintaining a higher EBITDA throughout the years. However, the absence of data for Xylem Inc. in 2024 suggests potential challenges or reporting delays. This analysis underscores the dynamic nature of these industries and the importance of financial resilience.
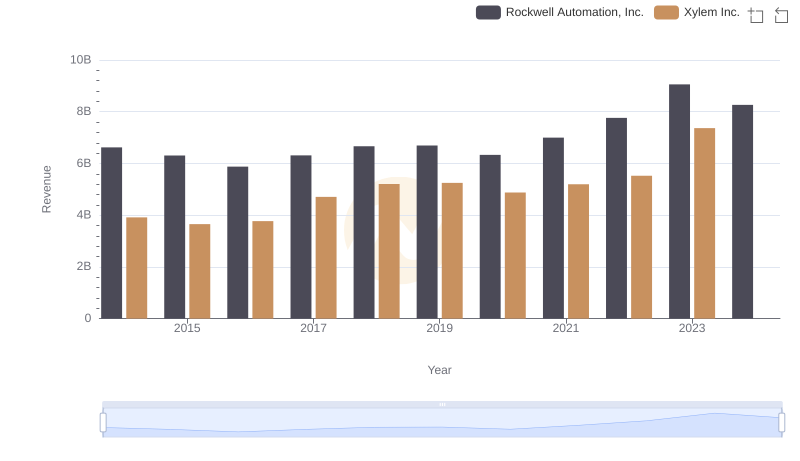
Revenue Showdown: Rockwell Automation, Inc. vs Xylem Inc.
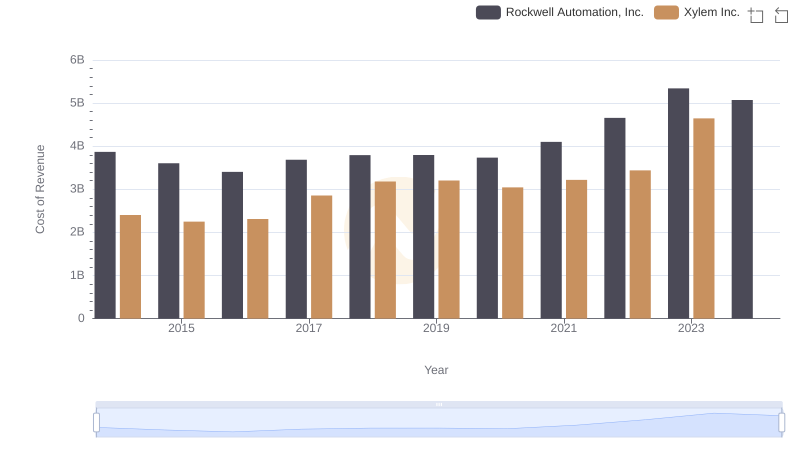
Analyzing Cost of Revenue: Rockwell Automation, Inc. and Xylem Inc.
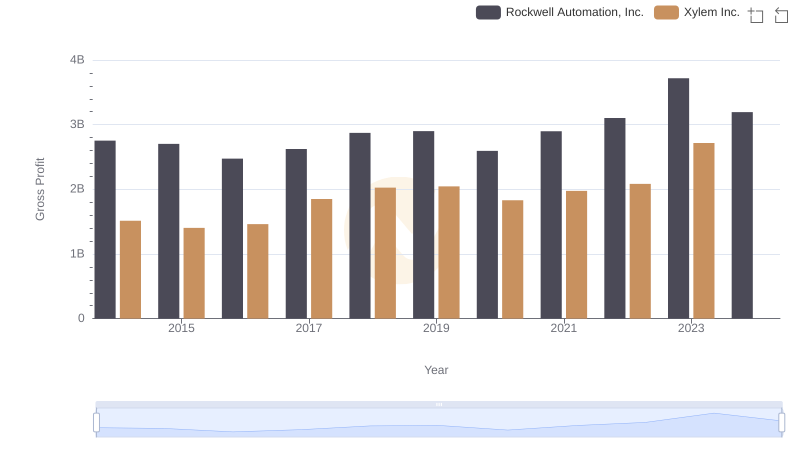
Gross Profit Comparison: Rockwell Automation, Inc. and Xylem Inc. Trends
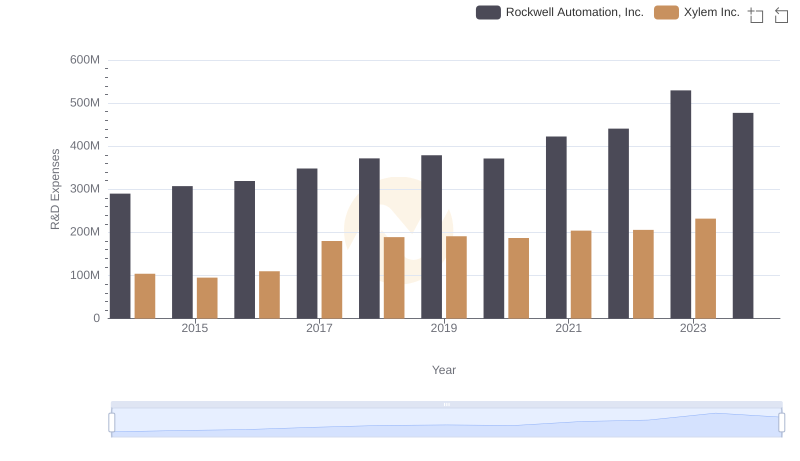
Analyzing R&D Budgets: Rockwell Automation, Inc. vs Xylem Inc.
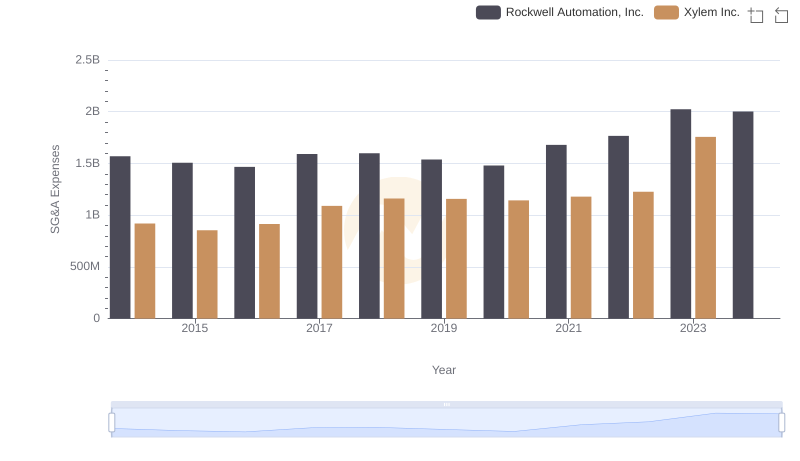
Who Optimizes SG&A Costs Better? Rockwell Automation, Inc. or Xylem Inc.
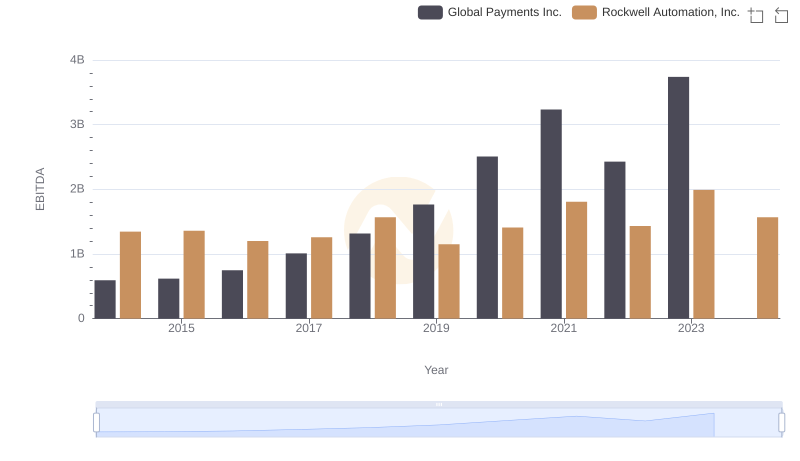
Rockwell Automation, Inc. vs Global Payments Inc.: In-Depth EBITDA Performance Comparison
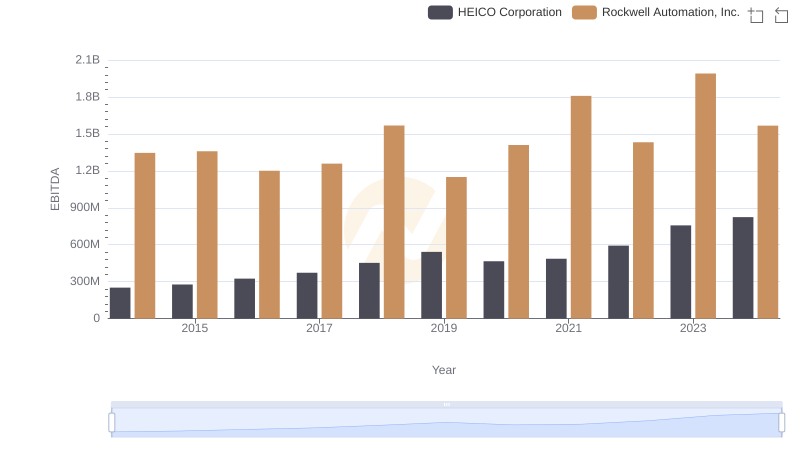
EBITDA Analysis: Evaluating Rockwell Automation, Inc. Against HEICO Corporation
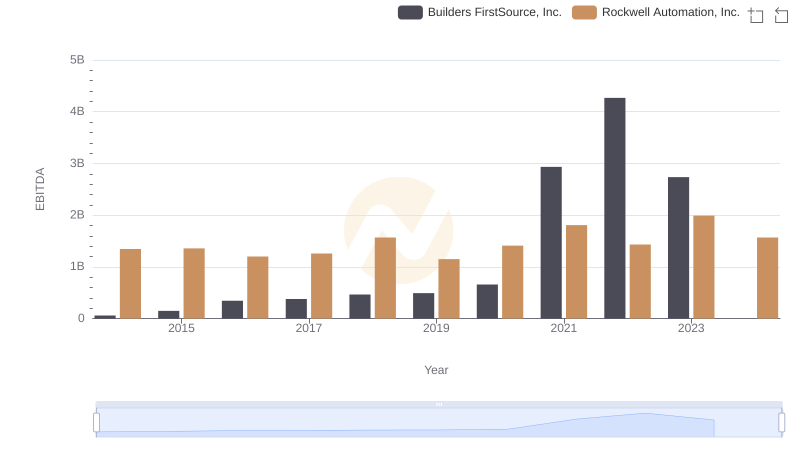
EBITDA Analysis: Evaluating Rockwell Automation, Inc. Against Builders FirstSource, Inc.
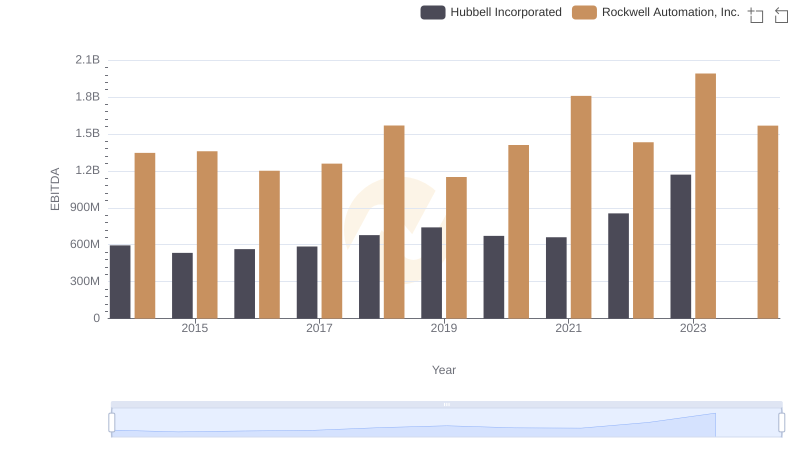
A Professional Review of EBITDA: Rockwell Automation, Inc. Compared to Hubbell Incorporated
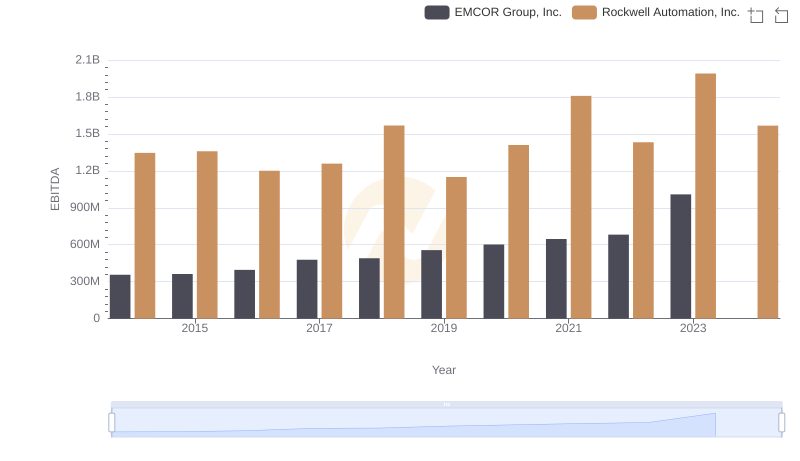
Rockwell Automation, Inc. and EMCOR Group, Inc.: A Detailed Examination of EBITDA Performance
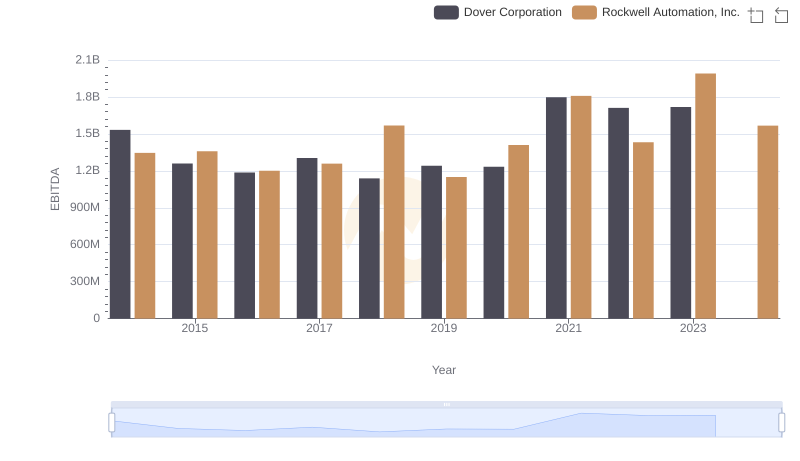
EBITDA Performance Review: Rockwell Automation, Inc. vs Dover Corporation
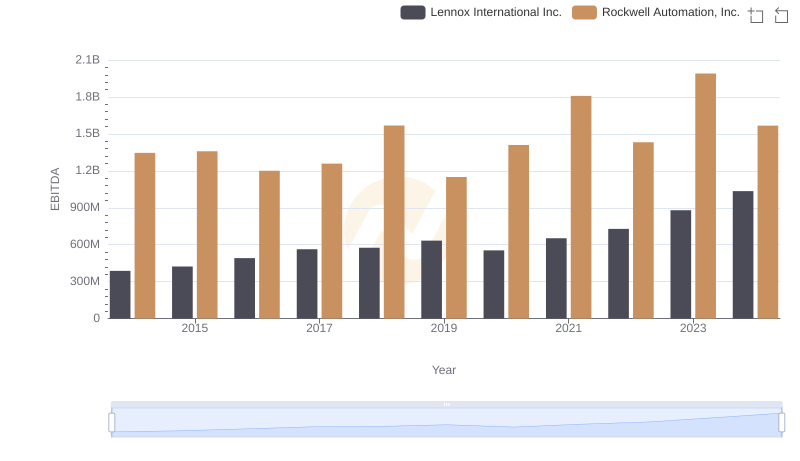
EBITDA Performance Review: Rockwell Automation, Inc. vs Lennox International Inc.