| __timestamp | AerCap Holdings N.V. | Rockwell Automation, Inc. |
|---|---|---|
| Wednesday, January 1, 2014 | 2252878000 | 3869600000 |
| Thursday, January 1, 2015 | 3776407000 | 3604800000 |
| Friday, January 1, 2016 | 3465727000 | 3404000000 |
| Sunday, January 1, 2017 | 3377439000 | 3687100000 |
| Monday, January 1, 2018 | 3299635000 | 3793800000 |
| Tuesday, January 1, 2019 | 3259091000 | 3794700000 |
| Wednesday, January 1, 2020 | 3217133000 | 3734600000 |
| Friday, January 1, 2021 | 3287413000 | 4099700000 |
| Saturday, January 1, 2022 | 4805277000 | 4658400000 |
| Sunday, January 1, 2023 | 3237016000 | 5341000000 |
| Monday, January 1, 2024 | 5070800000 |
Unleashing the power of data
In the ever-evolving landscape of industrial automation and aviation leasing, Rockwell Automation, Inc. and AerCap Holdings N.V. stand as titans. From 2014 to 2023, these companies have showcased intriguing trends in their cost of revenue, a critical metric reflecting the direct costs attributable to the production of goods sold by a company.
Rockwell Automation, a leader in industrial automation, has seen a steady increase in its cost of revenue, peaking in 2023 with a 38% rise from its 2014 figures. This growth underscores the company's expanding operations and market reach. Meanwhile, AerCap Holdings, a major player in aircraft leasing, experienced a significant spike in 2022, with costs surging by 47% compared to 2014, before stabilizing in 2023.
These trends highlight the dynamic nature of these industries, with Rockwell's consistent growth and AerCap's fluctuating costs reflecting broader market forces and strategic decisions.
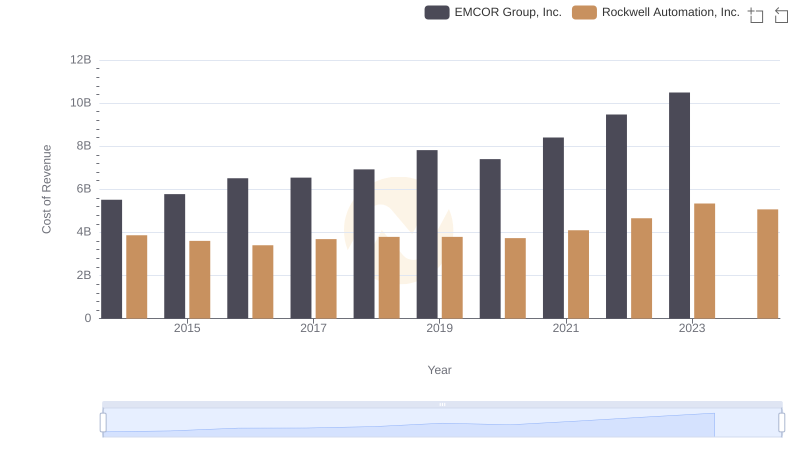
Cost of Revenue Comparison: Rockwell Automation, Inc. vs EMCOR Group, Inc.
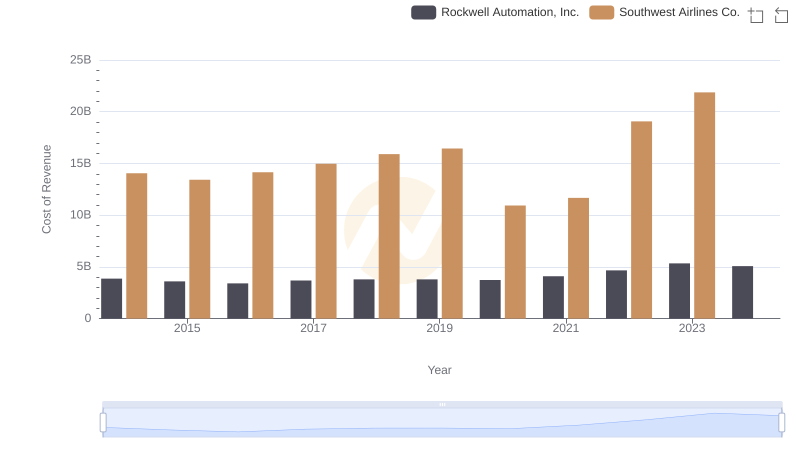
Cost Insights: Breaking Down Rockwell Automation, Inc. and Southwest Airlines Co.'s Expenses

Cost Insights: Breaking Down Rockwell Automation, Inc. and TransUnion's Expenses
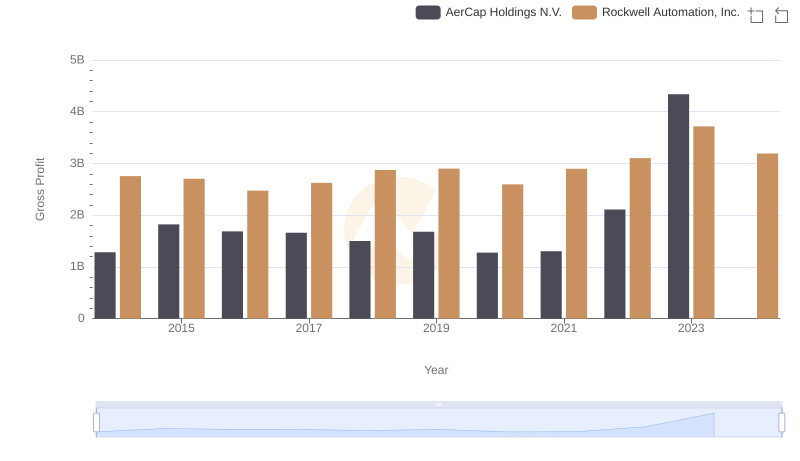
Gross Profit Comparison: Rockwell Automation, Inc. and AerCap Holdings N.V. Trends
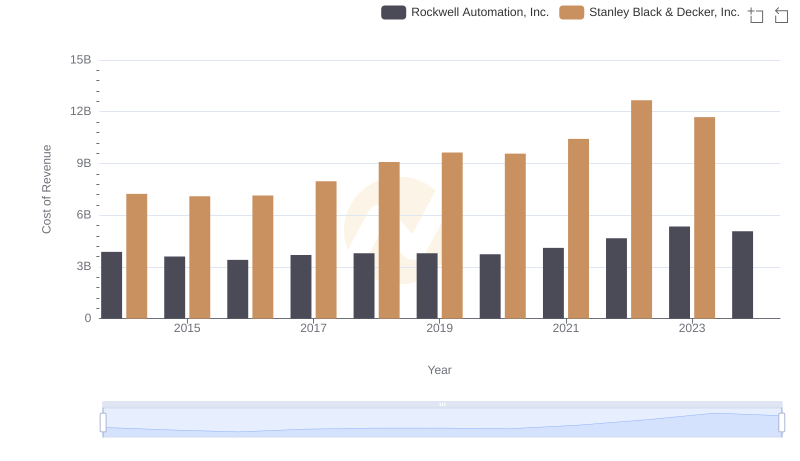
Comparing Cost of Revenue Efficiency: Rockwell Automation, Inc. vs Stanley Black & Decker, Inc.
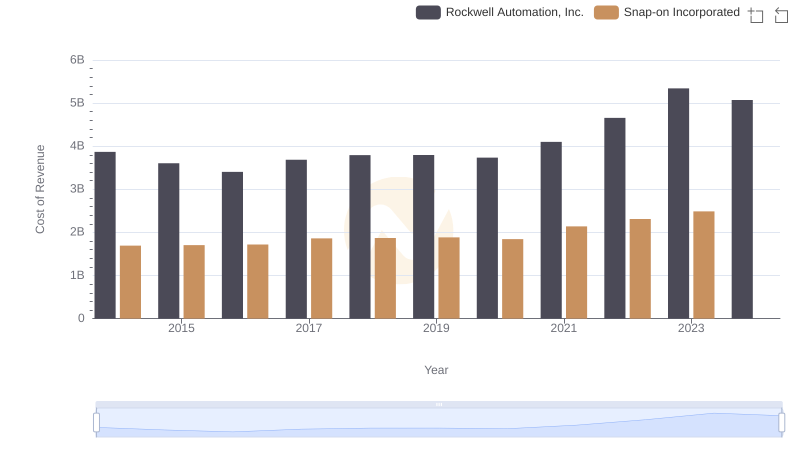
Cost Insights: Breaking Down Rockwell Automation, Inc. and Snap-on Incorporated's Expenses
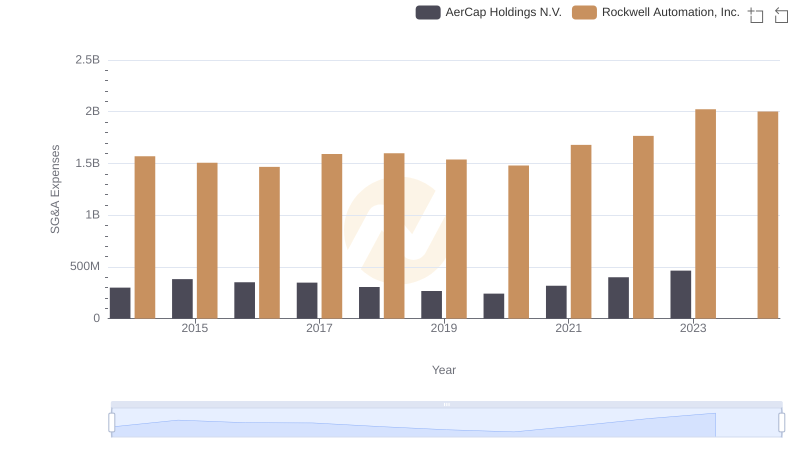
Rockwell Automation, Inc. or AerCap Holdings N.V.: Who Manages SG&A Costs Better?
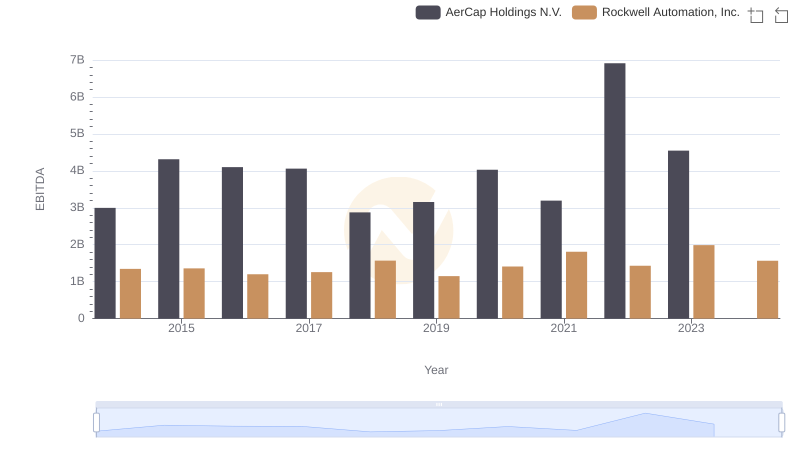
Comprehensive EBITDA Comparison: Rockwell Automation, Inc. vs AerCap Holdings N.V.