| __timestamp | Dover Corporation | Rockwell Automation, Inc. |
|---|---|---|
| Wednesday, January 1, 2014 | 1533084000 | 1346000000 |
| Thursday, January 1, 2015 | 1259375000 | 1359100000 |
| Friday, January 1, 2016 | 1186472000 | 1200700000 |
| Sunday, January 1, 2017 | 1304041000 | 1258400000 |
| Monday, January 1, 2018 | 1138930000 | 1568400000 |
| Tuesday, January 1, 2019 | 1241114000 | 1150200000 |
| Wednesday, January 1, 2020 | 1232722000 | 1410200000 |
| Friday, January 1, 2021 | 1797268000 | 1808300000 |
| Saturday, January 1, 2022 | 1711499000 | 1432100000 |
| Sunday, January 1, 2023 | 1718774000 | 1990700000 |
| Monday, January 1, 2024 | 1206355000 | 1567500000 |
Igniting the spark of knowledge
In the ever-evolving landscape of industrial automation and manufacturing, Rockwell Automation, Inc. and Dover Corporation have been pivotal players. Over the past decade, from 2014 to 2023, these giants have showcased intriguing trends in their EBITDA performance. Rockwell Automation, with a notable peak in 2023, achieved an EBITDA of approximately $1.99 billion, marking a significant 48% increase from its 2016 low. Meanwhile, Dover Corporation experienced a steady climb, peaking in 2021 with an EBITDA of around $1.80 billion, a 52% rise from its 2018 dip. The data reveals a competitive race, with Rockwell Automation taking the lead in recent years. However, the absence of data for Dover in 2024 leaves room for speculation. As the industry continues to innovate, these companies' financial trajectories will be crucial for investors and stakeholders alike.
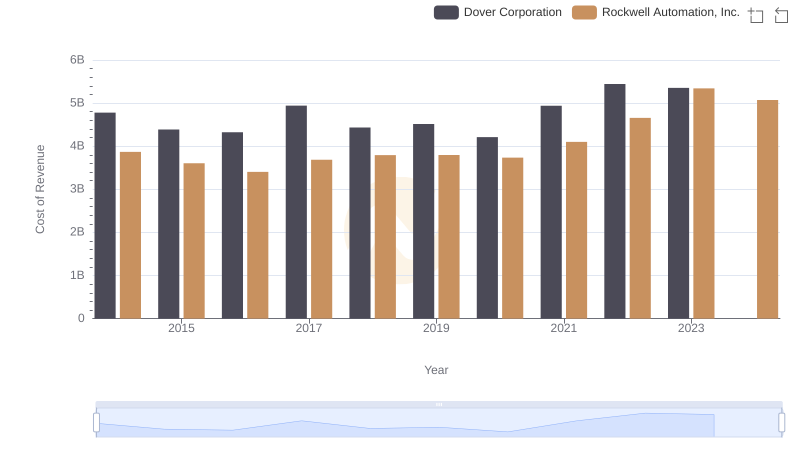
Analyzing Cost of Revenue: Rockwell Automation, Inc. and Dover Corporation
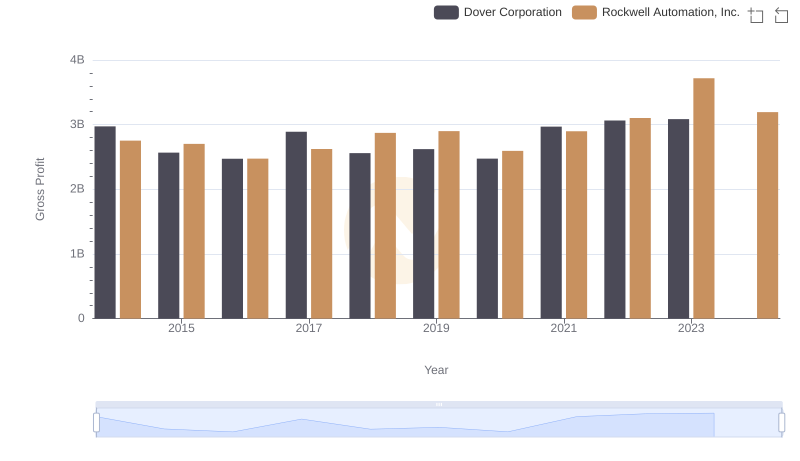
Gross Profit Analysis: Comparing Rockwell Automation, Inc. and Dover Corporation
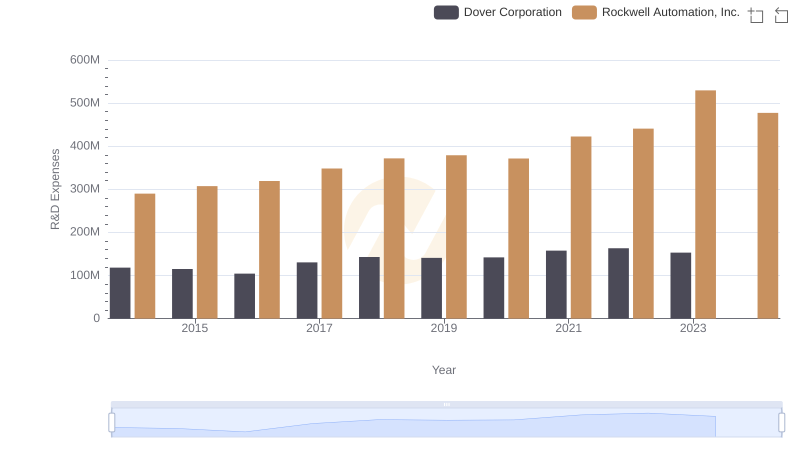
Analyzing R&D Budgets: Rockwell Automation, Inc. vs Dover Corporation
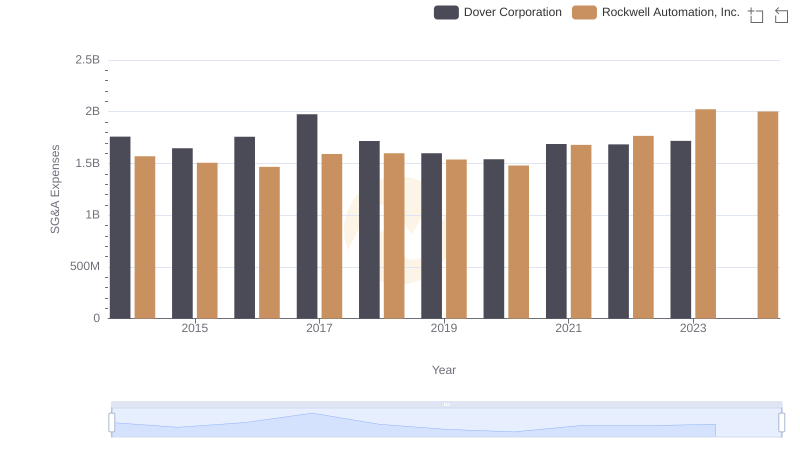
Cost Management Insights: SG&A Expenses for Rockwell Automation, Inc. and Dover Corporation
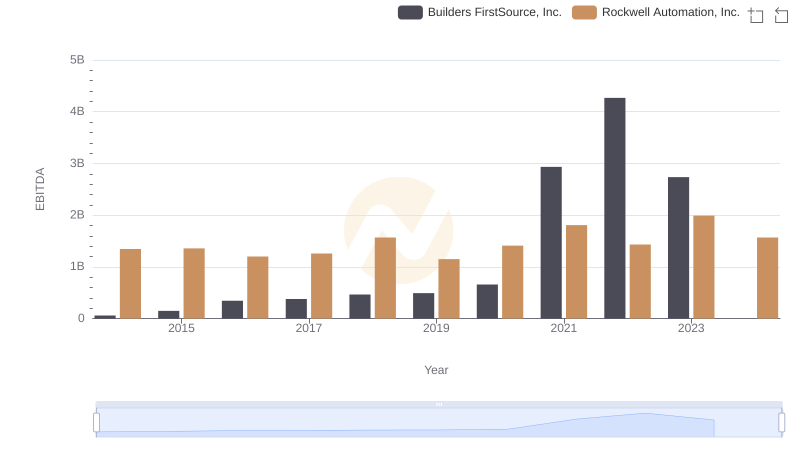
EBITDA Analysis: Evaluating Rockwell Automation, Inc. Against Builders FirstSource, Inc.
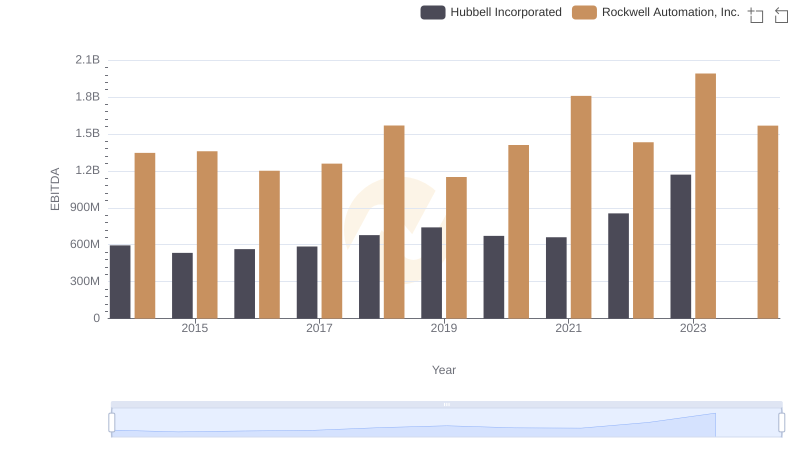
A Professional Review of EBITDA: Rockwell Automation, Inc. Compared to Hubbell Incorporated
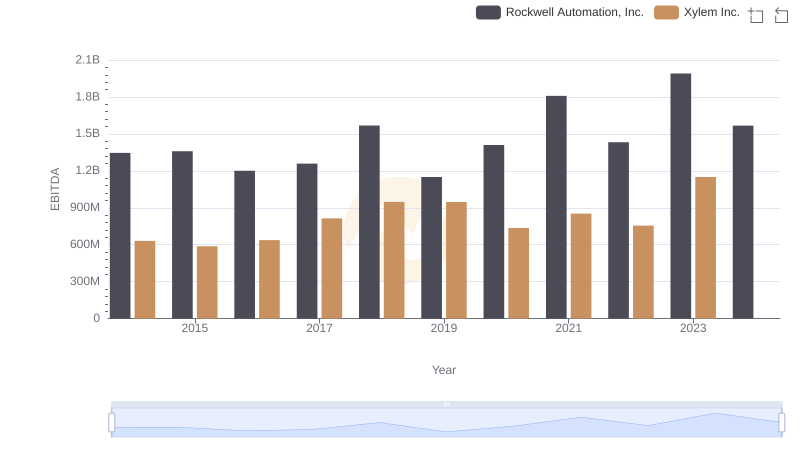
Professional EBITDA Benchmarking: Rockwell Automation, Inc. vs Xylem Inc.
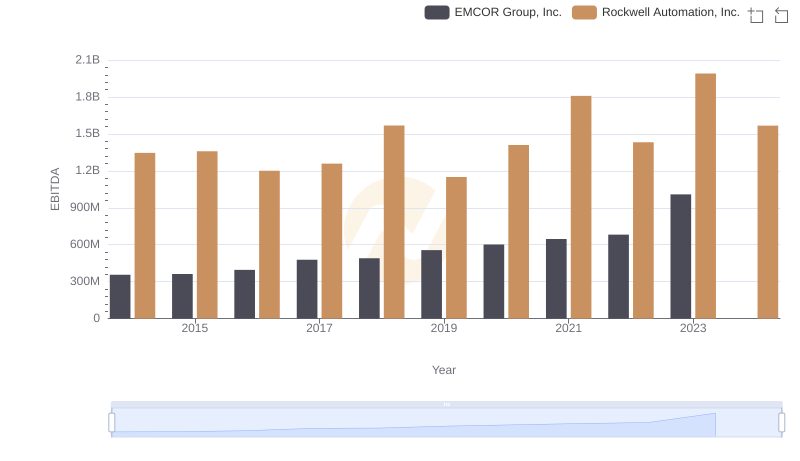
Rockwell Automation, Inc. and EMCOR Group, Inc.: A Detailed Examination of EBITDA Performance
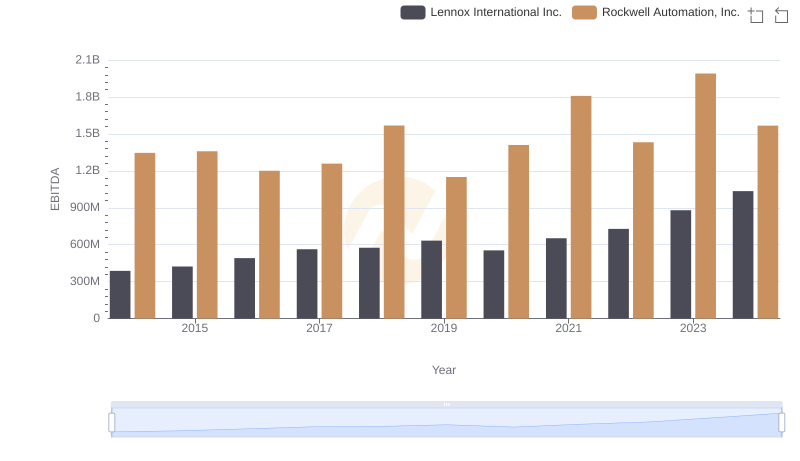
EBITDA Performance Review: Rockwell Automation, Inc. vs Lennox International Inc.
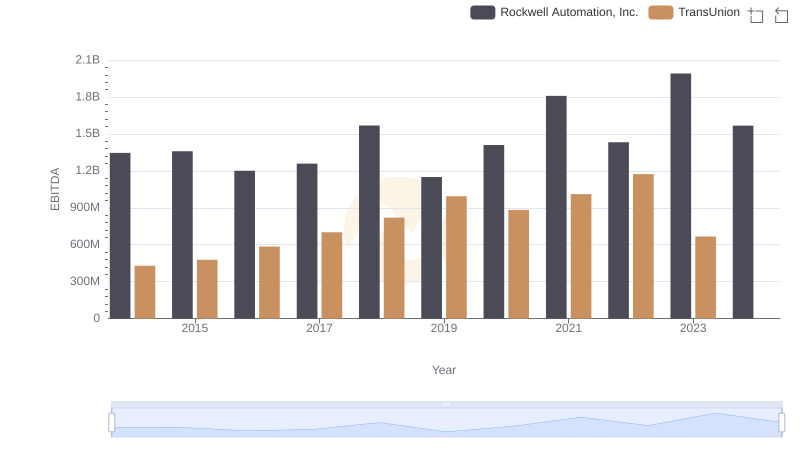
Comparative EBITDA Analysis: Rockwell Automation, Inc. vs TransUnion
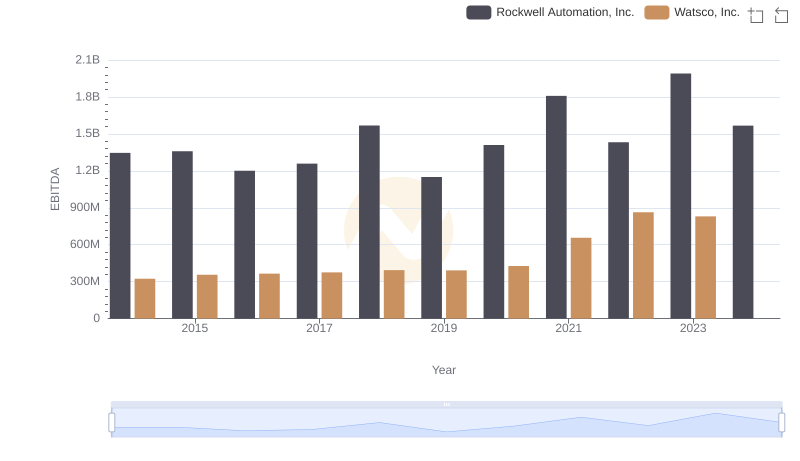
Comprehensive EBITDA Comparison: Rockwell Automation, Inc. vs Watsco, Inc.