| __timestamp | Rockwell Automation, Inc. | TransUnion |
|---|---|---|
| Wednesday, January 1, 2014 | 1346000000 | 429400000 |
| Thursday, January 1, 2015 | 1359100000 | 478200000 |
| Friday, January 1, 2016 | 1200700000 | 585300000 |
| Sunday, January 1, 2017 | 1258400000 | 701100000 |
| Monday, January 1, 2018 | 1568400000 | 819800000 |
| Tuesday, January 1, 2019 | 1150200000 | 993200000 |
| Wednesday, January 1, 2020 | 1410200000 | 883400000 |
| Friday, January 1, 2021 | 1808300000 | 1010500000 |
| Saturday, January 1, 2022 | 1432100000 | 1173800000 |
| Sunday, January 1, 2023 | 1990700000 | 667300000 |
| Monday, January 1, 2024 | 1567500000 | 1204100000 |
Infusing magic into the data realm
In the ever-evolving landscape of industrial automation and credit reporting, Rockwell Automation and TransUnion have showcased intriguing financial trajectories over the past decade. From 2014 to 2023, Rockwell Automation's EBITDA has seen a robust growth of approximately 48%, peaking in 2023. This reflects the company's strategic advancements in automation technology. In contrast, TransUnion's EBITDA journey has been more volatile, with a notable 173% increase from 2014 to 2022, before a sharp decline in 2023. This fluctuation highlights the dynamic nature of the credit reporting industry, influenced by economic cycles and regulatory changes. Notably, data for 2024 is incomplete, leaving room for speculation on future trends. As these giants navigate their respective sectors, their financial performance offers valuable insights into broader market dynamics.
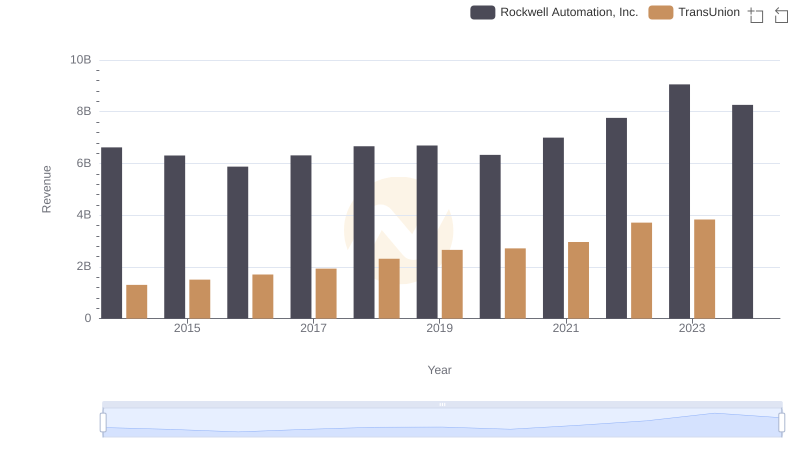
Revenue Showdown: Rockwell Automation, Inc. vs TransUnion

Cost Insights: Breaking Down Rockwell Automation, Inc. and TransUnion's Expenses
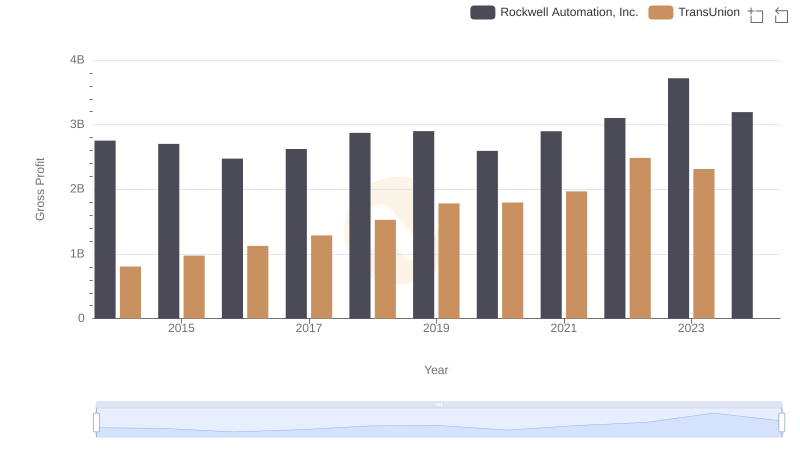
Rockwell Automation, Inc. and TransUnion: A Detailed Gross Profit Analysis
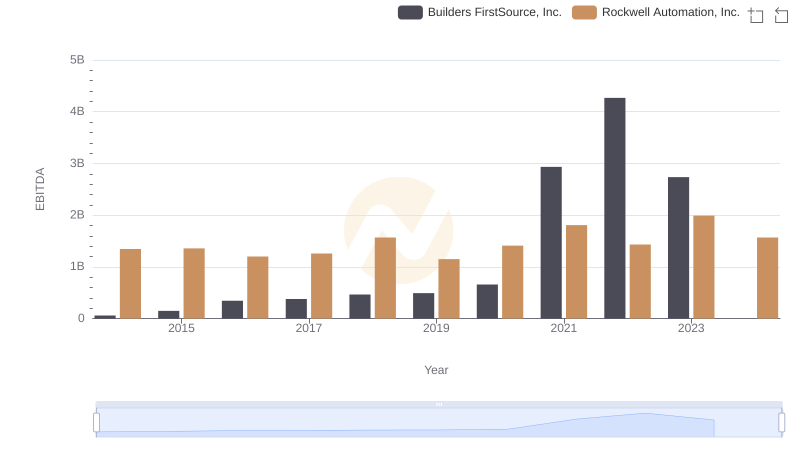
EBITDA Analysis: Evaluating Rockwell Automation, Inc. Against Builders FirstSource, Inc.
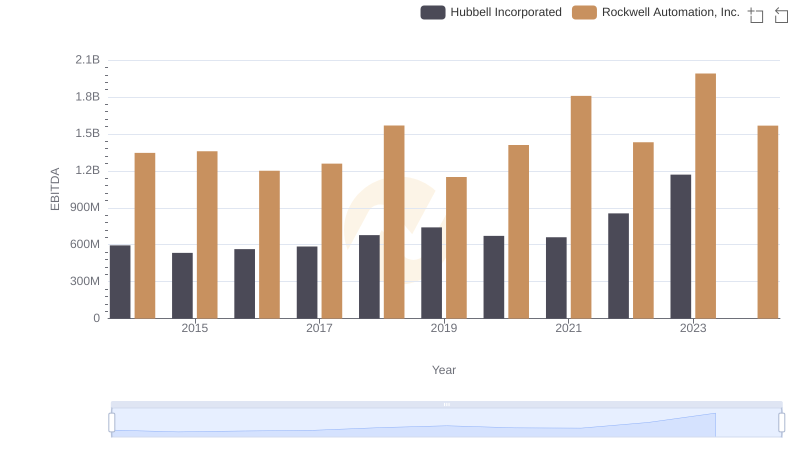
A Professional Review of EBITDA: Rockwell Automation, Inc. Compared to Hubbell Incorporated
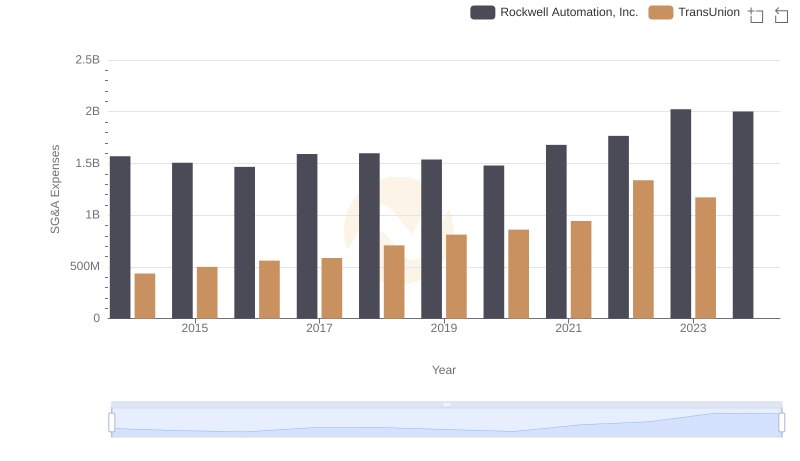
Breaking Down SG&A Expenses: Rockwell Automation, Inc. vs TransUnion
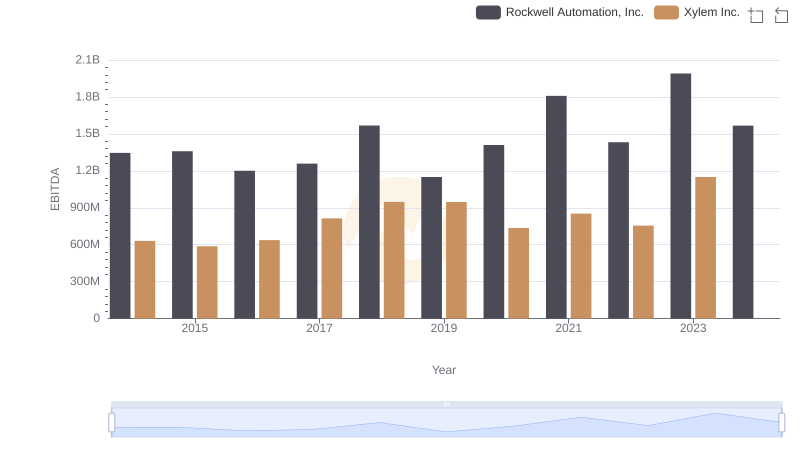
Professional EBITDA Benchmarking: Rockwell Automation, Inc. vs Xylem Inc.
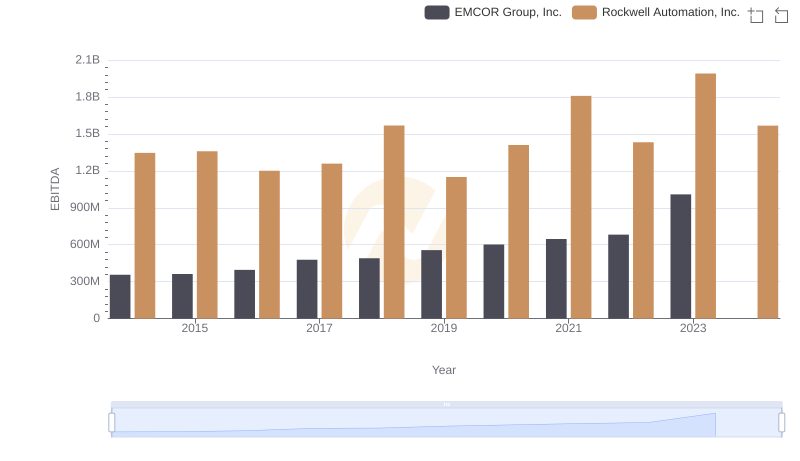
Rockwell Automation, Inc. and EMCOR Group, Inc.: A Detailed Examination of EBITDA Performance
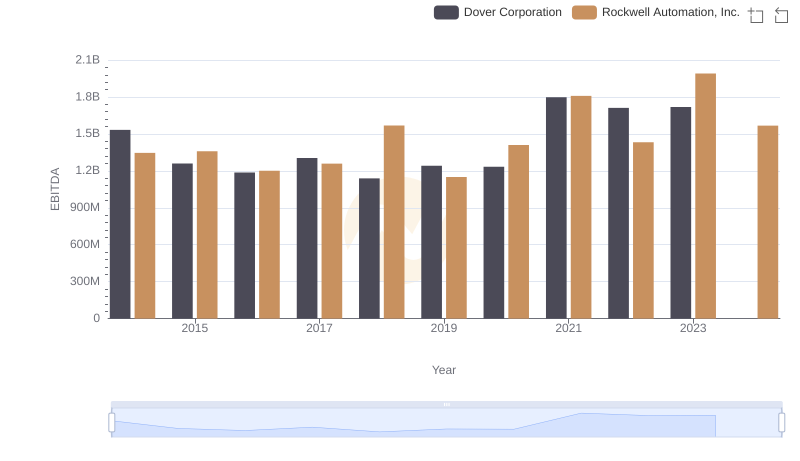
EBITDA Performance Review: Rockwell Automation, Inc. vs Dover Corporation
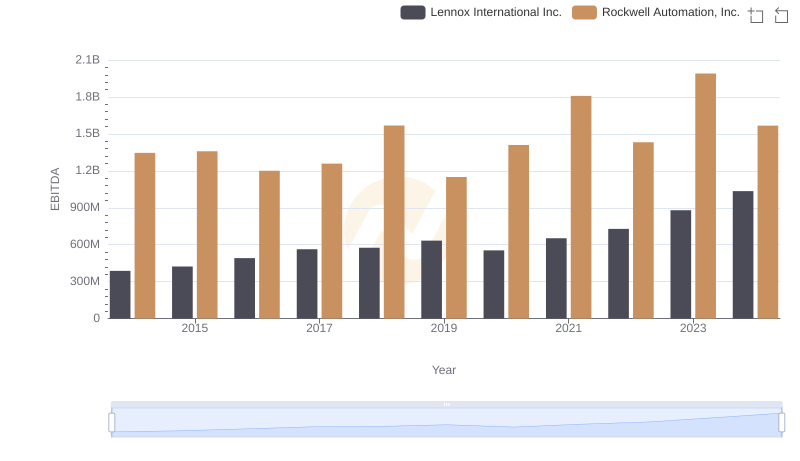
EBITDA Performance Review: Rockwell Automation, Inc. vs Lennox International Inc.
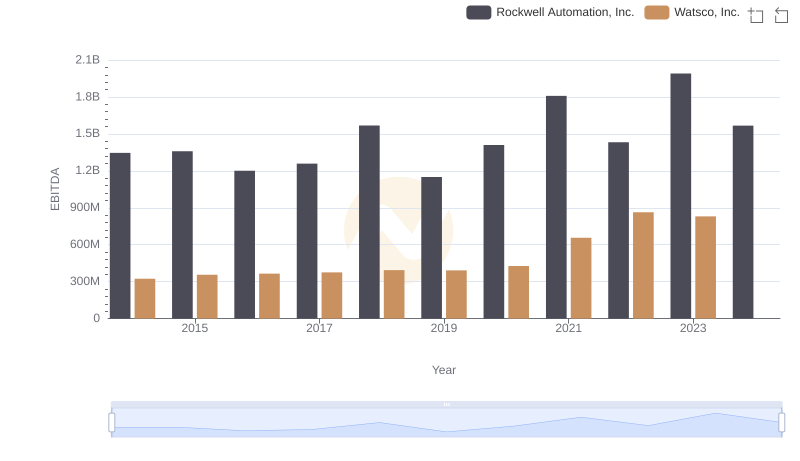
Comprehensive EBITDA Comparison: Rockwell Automation, Inc. vs Watsco, Inc.
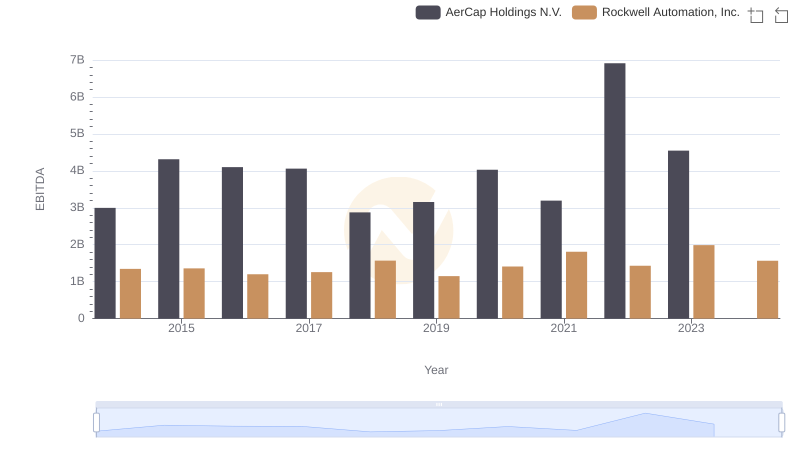
Comprehensive EBITDA Comparison: Rockwell Automation, Inc. vs AerCap Holdings N.V.