| __timestamp | Builders FirstSource, Inc. | Rockwell Automation, Inc. |
|---|---|---|
| Wednesday, January 1, 2014 | 60008000 | 1346000000 |
| Thursday, January 1, 2015 | 148897000 | 1359100000 |
| Friday, January 1, 2016 | 346129000 | 1200700000 |
| Sunday, January 1, 2017 | 378096000 | 1258400000 |
| Monday, January 1, 2018 | 466874000 | 1568400000 |
| Tuesday, January 1, 2019 | 492344000 | 1150200000 |
| Wednesday, January 1, 2020 | 660420000 | 1410200000 |
| Friday, January 1, 2021 | 2934776000 | 1808300000 |
| Saturday, January 1, 2022 | 4267346000 | 1432100000 |
| Sunday, January 1, 2023 | 2734594000 | 1990700000 |
| Monday, January 1, 2024 | 1567500000 |
Unleashing insights
In the ever-evolving landscape of industrial automation and construction materials, Rockwell Automation and Builders FirstSource stand as titans in their respective fields. Over the past decade, from 2014 to 2023, these companies have showcased distinct financial trajectories. Rockwell Automation, a leader in industrial automation, maintained a steady EBITDA growth, peaking at approximately $1.99 billion in 2023. In contrast, Builders FirstSource, a key player in the construction sector, experienced a dramatic surge, with EBITDA skyrocketing by over 7,000% from 2014 to 2022, before slightly declining in 2023. This divergence highlights the dynamic nature of these industries, with Builders FirstSource capitalizing on the construction boom, while Rockwell Automation steadily innovates in automation technology. Notably, data for 2024 is incomplete, leaving room for speculation on future trends.
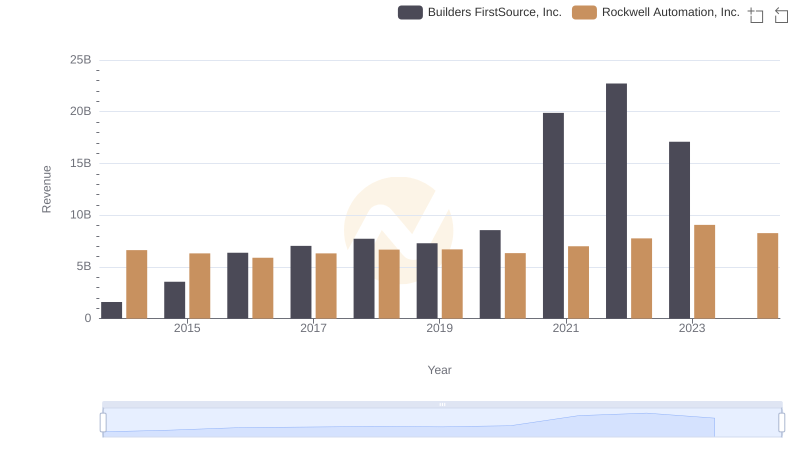
Revenue Insights: Rockwell Automation, Inc. and Builders FirstSource, Inc. Performance Compared
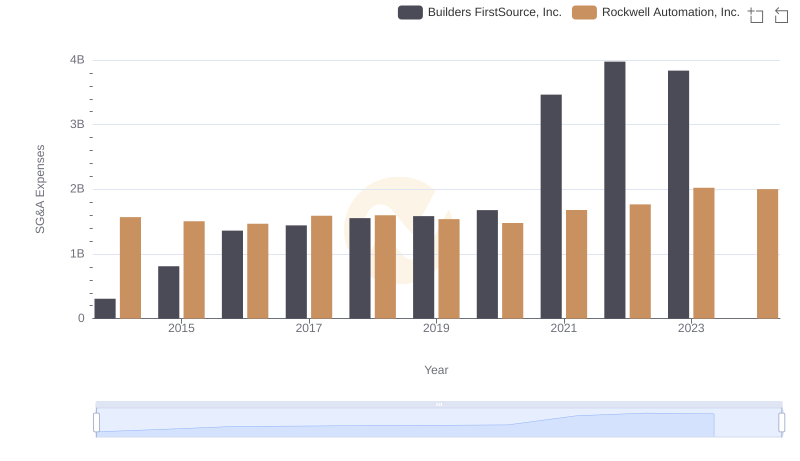
Operational Costs Compared: SG&A Analysis of Rockwell Automation, Inc. and Builders FirstSource, Inc.
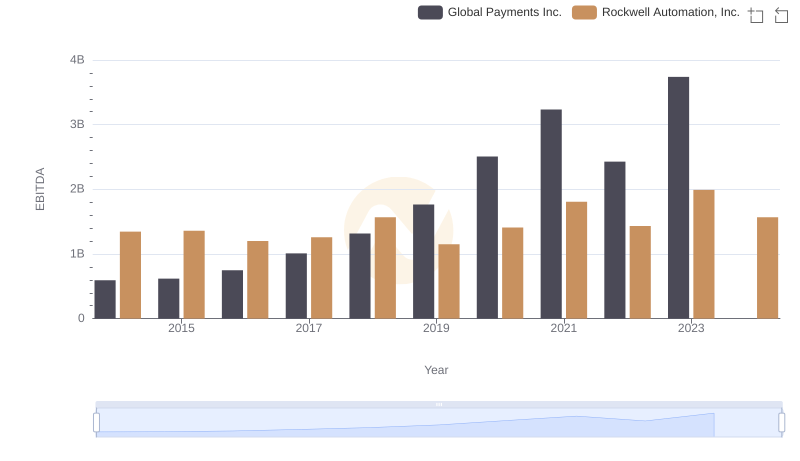
Rockwell Automation, Inc. vs Global Payments Inc.: In-Depth EBITDA Performance Comparison
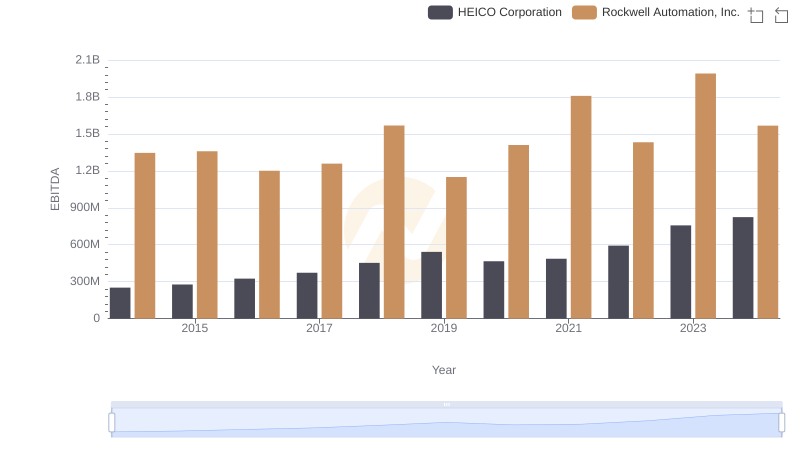
EBITDA Analysis: Evaluating Rockwell Automation, Inc. Against HEICO Corporation
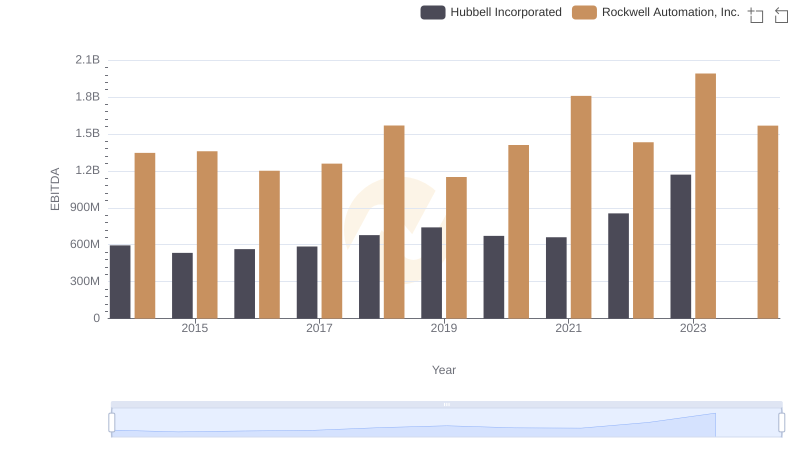
A Professional Review of EBITDA: Rockwell Automation, Inc. Compared to Hubbell Incorporated
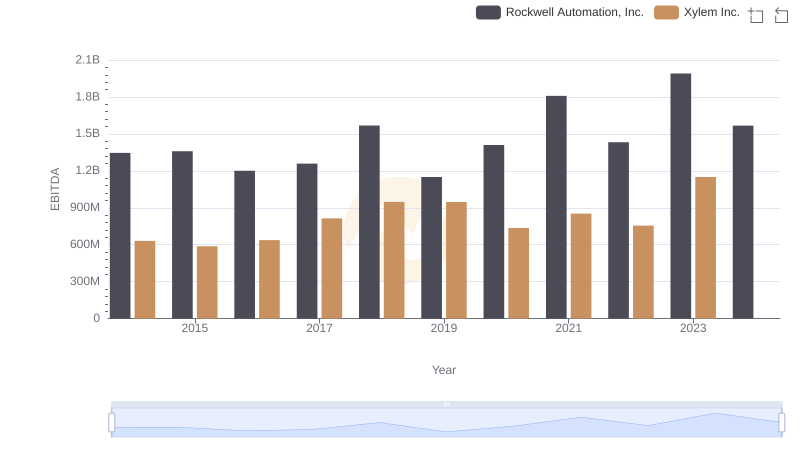
Professional EBITDA Benchmarking: Rockwell Automation, Inc. vs Xylem Inc.
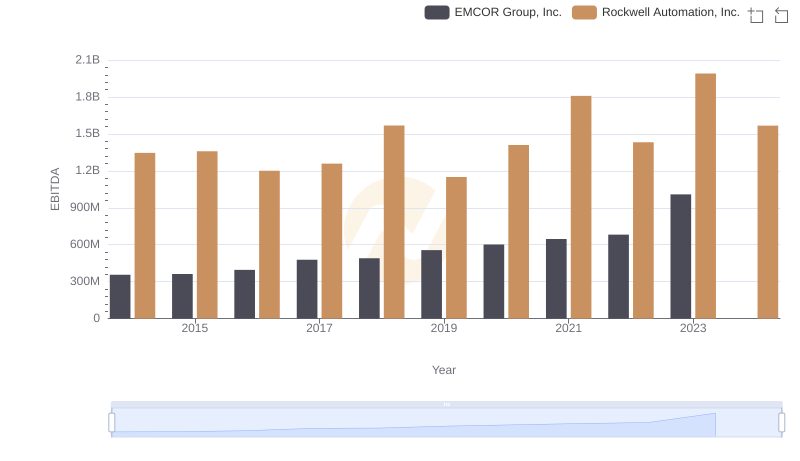
Rockwell Automation, Inc. and EMCOR Group, Inc.: A Detailed Examination of EBITDA Performance
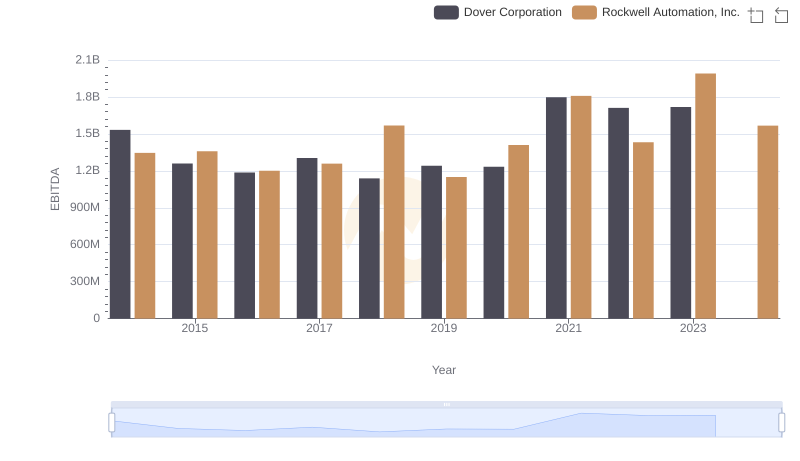
EBITDA Performance Review: Rockwell Automation, Inc. vs Dover Corporation
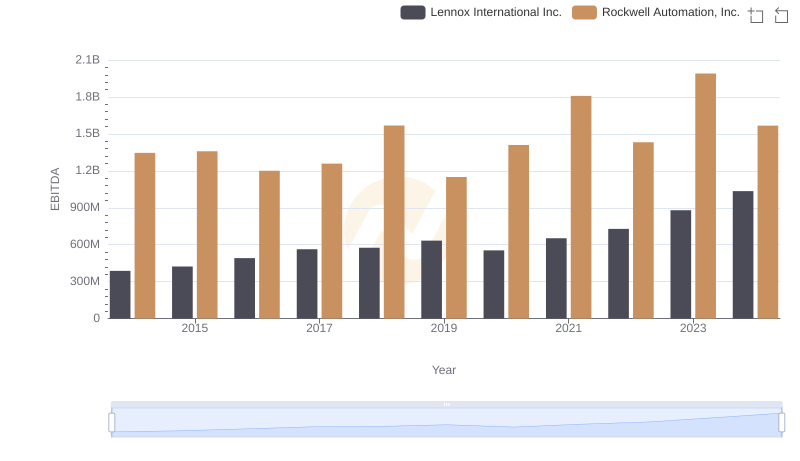
EBITDA Performance Review: Rockwell Automation, Inc. vs Lennox International Inc.
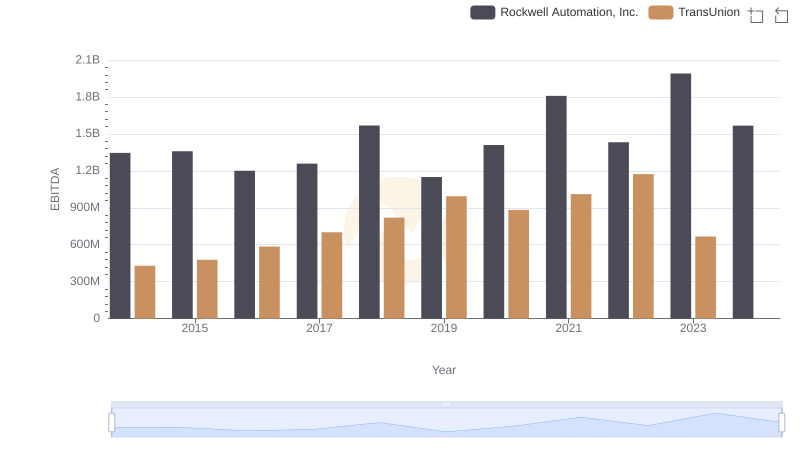
Comparative EBITDA Analysis: Rockwell Automation, Inc. vs TransUnion