| __timestamp | Lennox International Inc. | U-Haul Holding Company |
|---|---|---|
| Wednesday, January 1, 2014 | 387700000 | 923383000 |
| Thursday, January 1, 2015 | 423600000 | 1076520000 |
| Friday, January 1, 2016 | 490800000 | 1255474000 |
| Sunday, January 1, 2017 | 562900000 | 1195593000 |
| Monday, January 1, 2018 | 575200000 | 1123974000 |
| Tuesday, January 1, 2019 | 633300000 | 1200955000 |
| Wednesday, January 1, 2020 | 553900000 | 1202436000 |
| Friday, January 1, 2021 | 652500000 | 1627442000 |
| Saturday, January 1, 2022 | 729000000 | 2337788000 |
| Sunday, January 1, 2023 | 879500000 | 2183839000 |
| Monday, January 1, 2024 | 1034800000 | 1919656000 |
Unleashing the power of data
In the ever-evolving landscape of American business, Lennox International Inc. and U-Haul Holding Company have carved distinct niches. Over the past decade, from 2014 to 2024, these companies have demonstrated remarkable financial resilience, as evidenced by their EBITDA performance.
Lennox International Inc., a leader in climate control solutions, has seen its EBITDA grow by approximately 167%, from $388 million in 2014 to over $1 billion in 2024. This growth underscores its strategic focus on innovation and efficiency.
Meanwhile, U-Haul Holding Company, a household name in moving and storage, has experienced a 108% increase in EBITDA, reaching nearly $1.92 billion in 2024. This growth reflects its robust market presence and adaptability.
Both companies have shown consistent upward trends, with U-Haul maintaining a higher EBITDA throughout the period, highlighting its dominant market position. This comparison offers valuable insights into the financial trajectories of these industry giants.
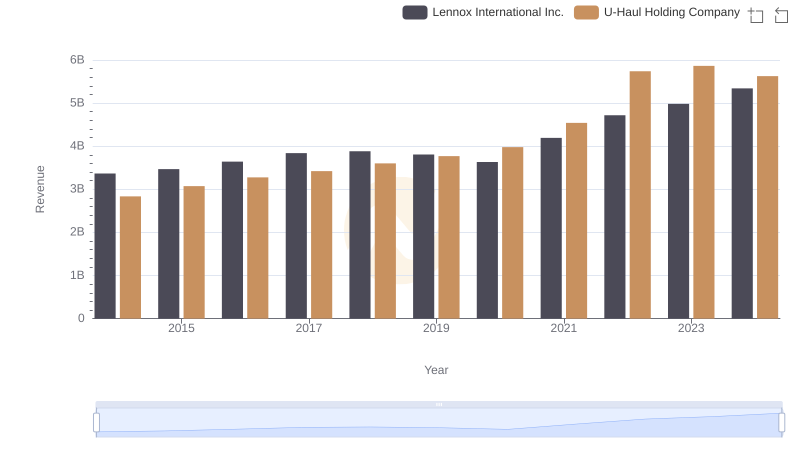
Lennox International Inc. and U-Haul Holding Company: A Comprehensive Revenue Analysis
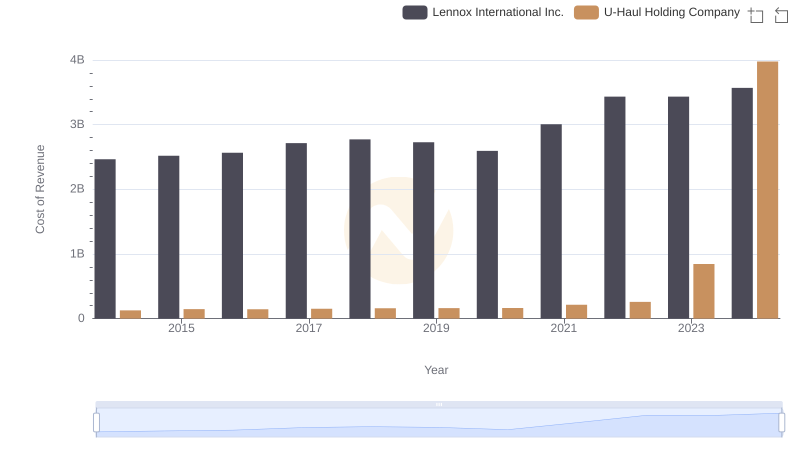
Cost Insights: Breaking Down Lennox International Inc. and U-Haul Holding Company's Expenses
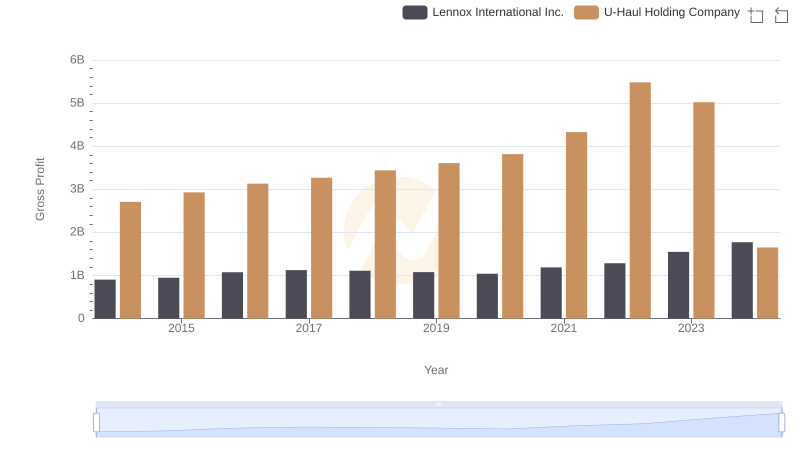
Lennox International Inc. vs U-Haul Holding Company: A Gross Profit Performance Breakdown
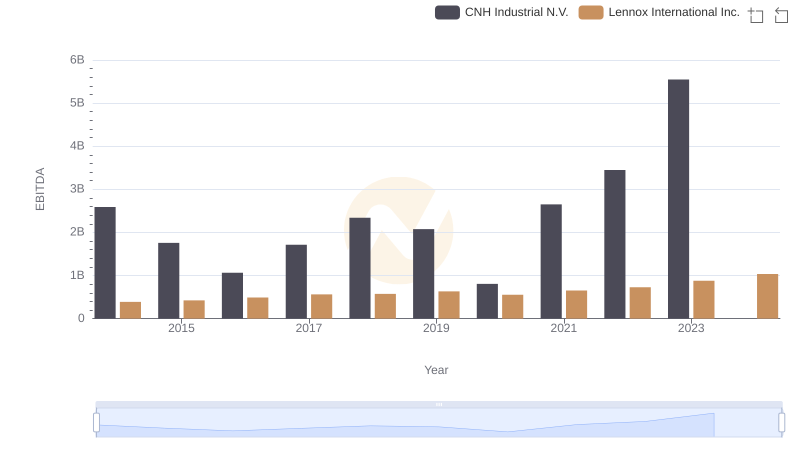
Comprehensive EBITDA Comparison: Lennox International Inc. vs CNH Industrial N.V.
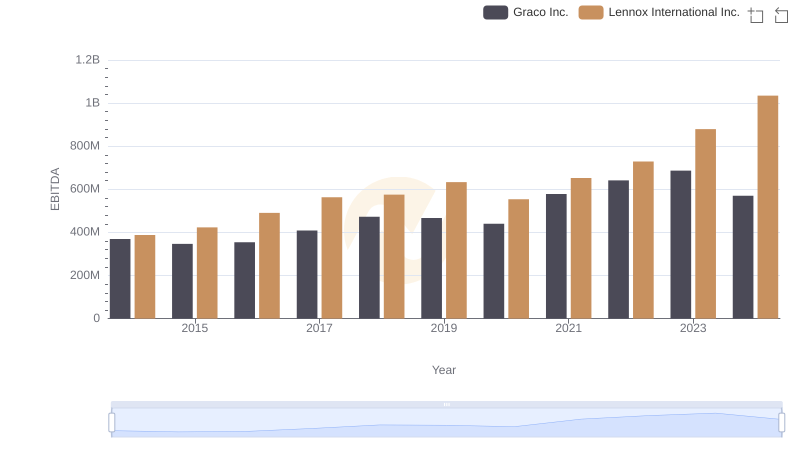
Comparative EBITDA Analysis: Lennox International Inc. vs Graco Inc.
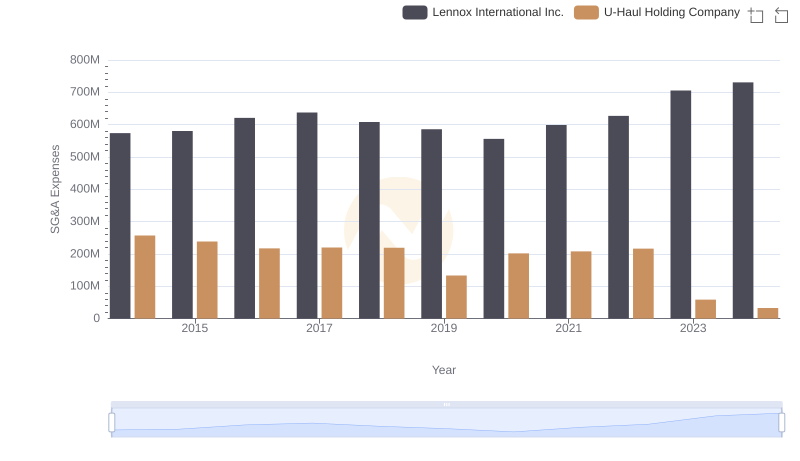
Selling, General, and Administrative Costs: Lennox International Inc. vs U-Haul Holding Company

Professional EBITDA Benchmarking: Lennox International Inc. vs Stanley Black & Decker, Inc.
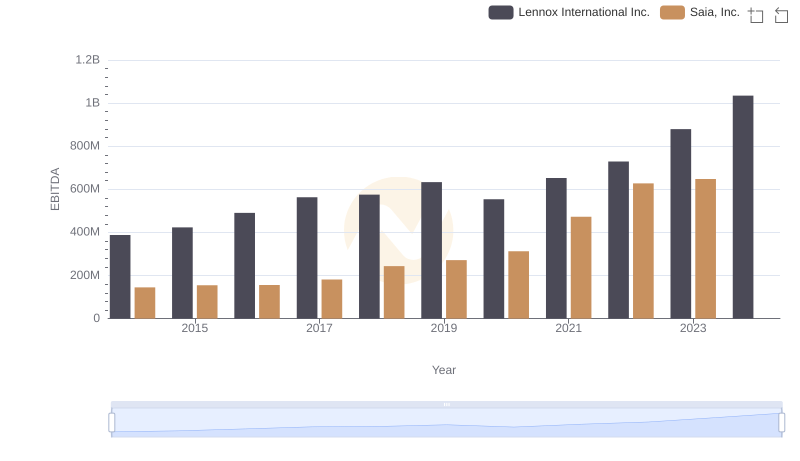
Comprehensive EBITDA Comparison: Lennox International Inc. vs Saia, Inc.
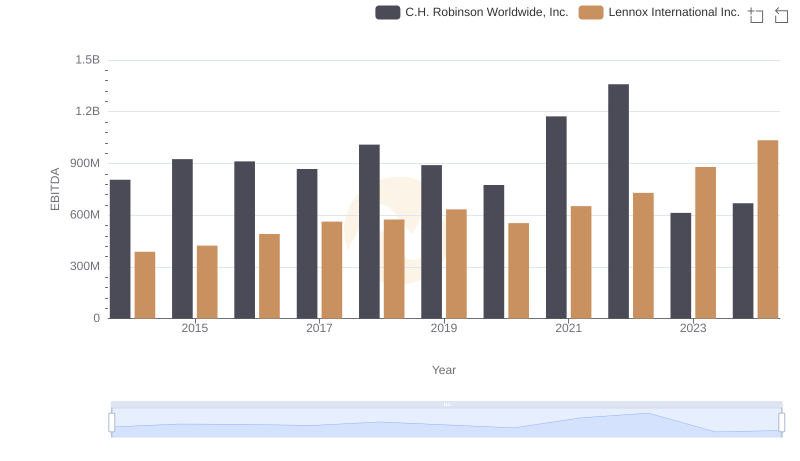
A Professional Review of EBITDA: Lennox International Inc. Compared to C.H. Robinson Worldwide, Inc.
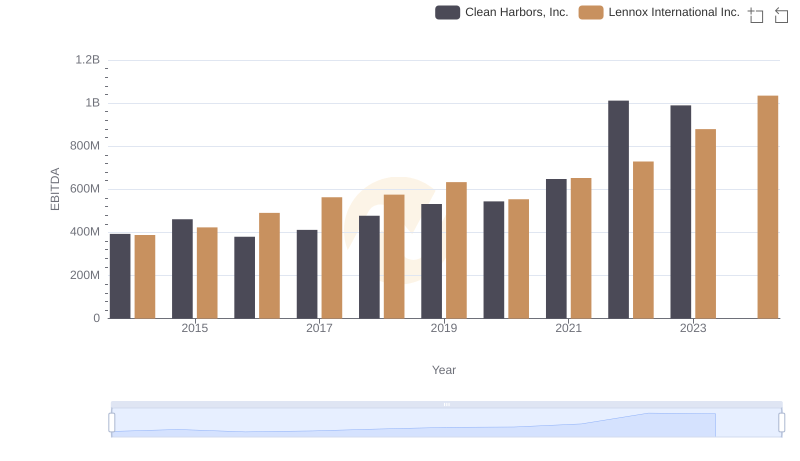
Comparative EBITDA Analysis: Lennox International Inc. vs Clean Harbors, Inc.
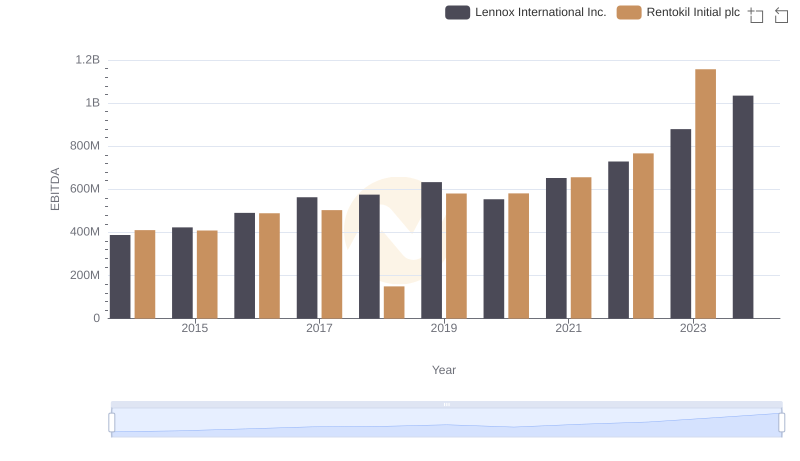
Lennox International Inc. vs Rentokil Initial plc: In-Depth EBITDA Performance Comparison
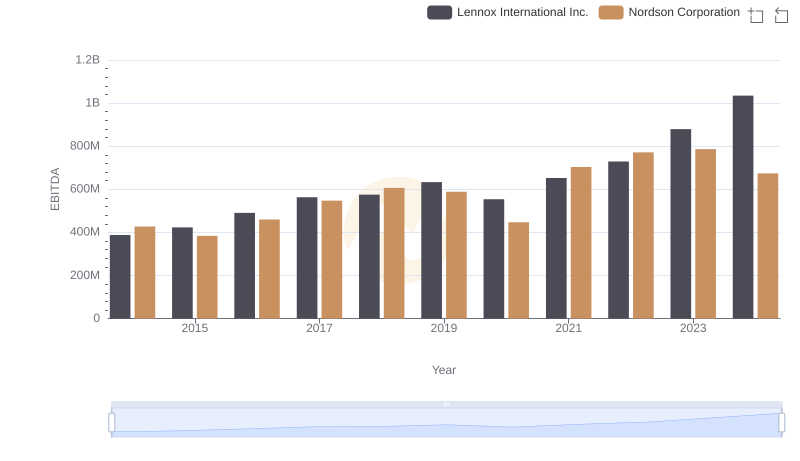
Lennox International Inc. vs Nordson Corporation: In-Depth EBITDA Performance Comparison