| __timestamp | C.H. Robinson Worldwide, Inc. | Lennox International Inc. |
|---|---|---|
| Wednesday, January 1, 2014 | 805427000 | 387700000 |
| Thursday, January 1, 2015 | 924719000 | 423600000 |
| Friday, January 1, 2016 | 912200000 | 490800000 |
| Sunday, January 1, 2017 | 868096000 | 562900000 |
| Monday, January 1, 2018 | 1008812000 | 575200000 |
| Tuesday, January 1, 2019 | 890425000 | 633300000 |
| Wednesday, January 1, 2020 | 774995000 | 553900000 |
| Friday, January 1, 2021 | 1173367000 | 652500000 |
| Saturday, January 1, 2022 | 1359558000 | 729000000 |
| Sunday, January 1, 2023 | 613592000 | 879500000 |
| Monday, January 1, 2024 | 766301000 | 1034800000 |
Unlocking the unknown
In the ever-evolving landscape of corporate finance, EBITDA serves as a crucial metric for evaluating a company's operational performance. Over the past decade, Lennox International Inc. and C.H. Robinson Worldwide, Inc. have showcased intriguing trends in their EBITDA figures. From 2014 to 2024, Lennox International has demonstrated a robust growth trajectory, with its EBITDA increasing by approximately 167%, reaching over $1 billion in 2024. In contrast, C.H. Robinson Worldwide experienced a more volatile journey, peaking in 2022 with a 68% increase from 2014, before a notable decline in 2023. This divergence highlights the resilience of Lennox International in maintaining steady growth, while C.H. Robinson faces challenges in sustaining its peak performance. As we look to the future, these trends offer valuable insights into the strategic maneuvers and market conditions influencing these industry giants.
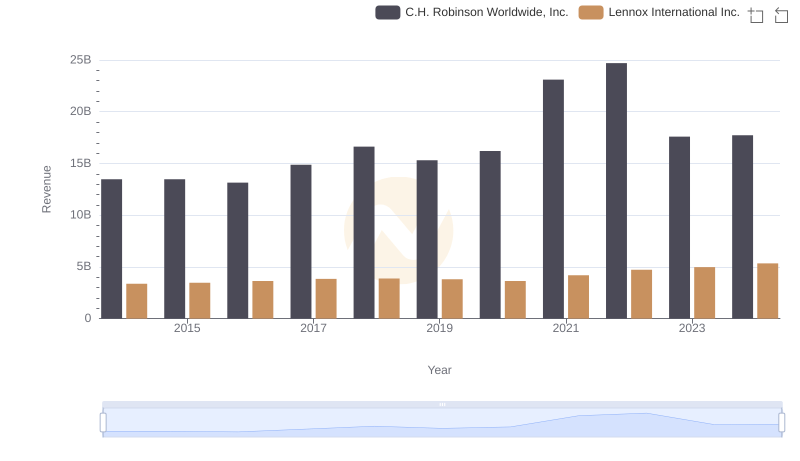
Revenue Showdown: Lennox International Inc. vs C.H. Robinson Worldwide, Inc.
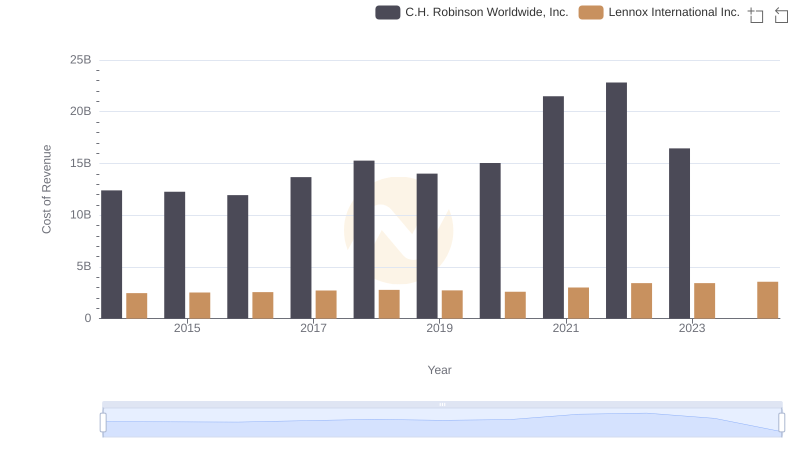
Cost of Revenue: Key Insights for Lennox International Inc. and C.H. Robinson Worldwide, Inc.
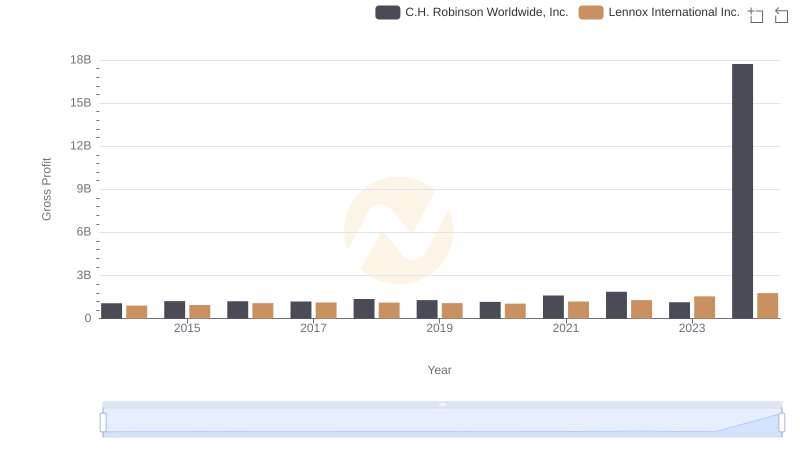
Gross Profit Analysis: Comparing Lennox International Inc. and C.H. Robinson Worldwide, Inc.
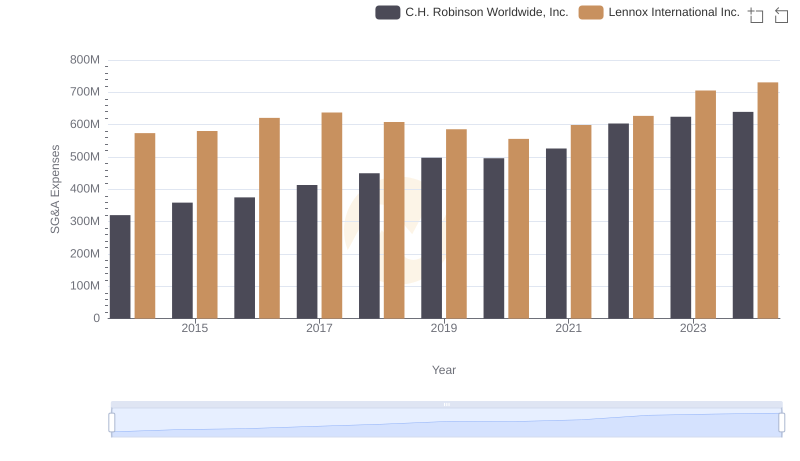
Comparing SG&A Expenses: Lennox International Inc. vs C.H. Robinson Worldwide, Inc. Trends and Insights

Professional EBITDA Benchmarking: Lennox International Inc. vs Stanley Black & Decker, Inc.
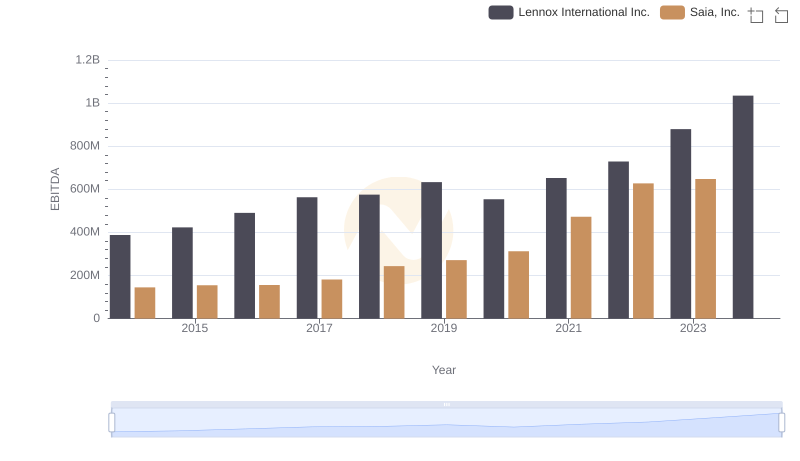
Comprehensive EBITDA Comparison: Lennox International Inc. vs Saia, Inc.
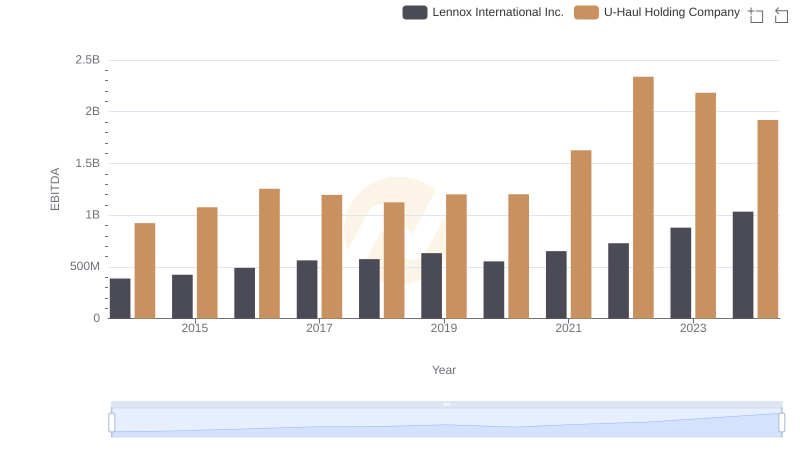
A Professional Review of EBITDA: Lennox International Inc. Compared to U-Haul Holding Company
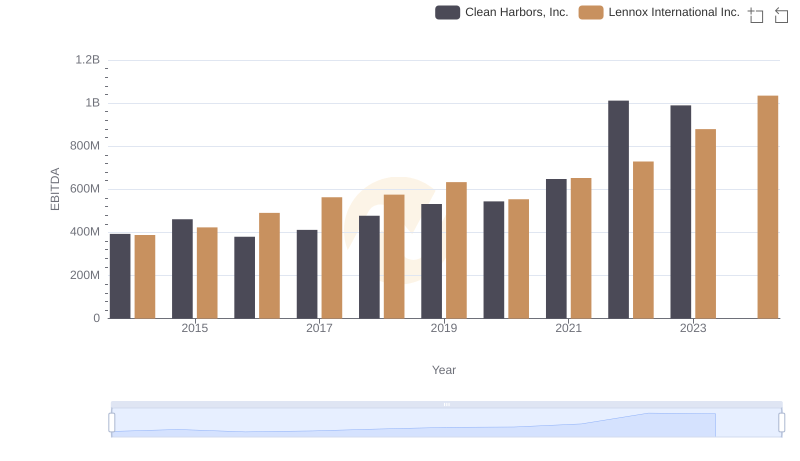
Comparative EBITDA Analysis: Lennox International Inc. vs Clean Harbors, Inc.
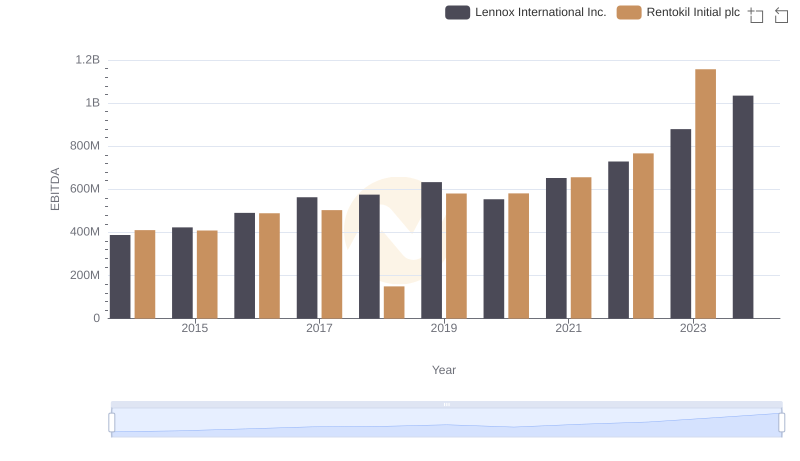
Lennox International Inc. vs Rentokil Initial plc: In-Depth EBITDA Performance Comparison
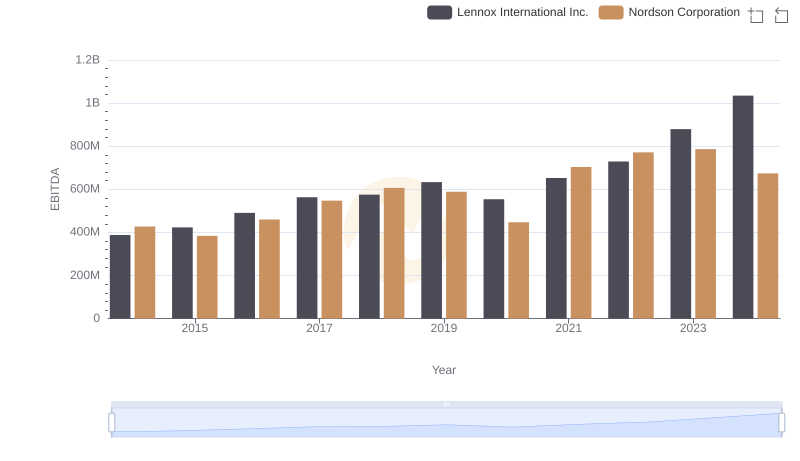
Lennox International Inc. vs Nordson Corporation: In-Depth EBITDA Performance Comparison

Professional EBITDA Benchmarking: Lennox International Inc. vs Curtiss-Wright Corporation
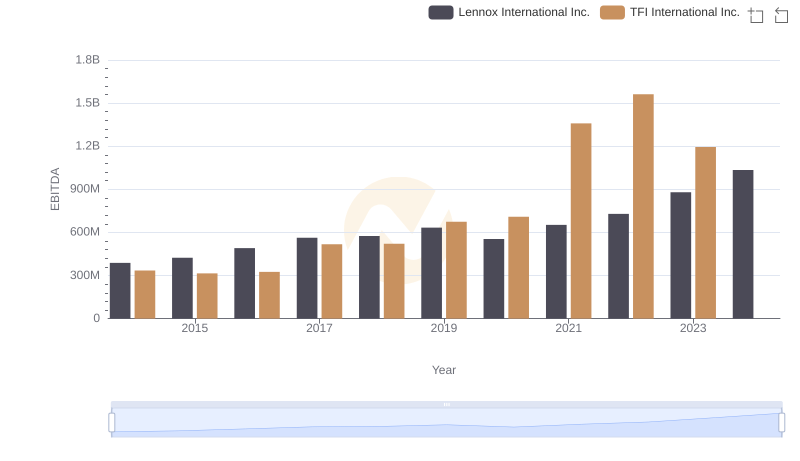
A Professional Review of EBITDA: Lennox International Inc. Compared to TFI International Inc.