| __timestamp | Lennox International Inc. | Rentokil Initial plc |
|---|---|---|
| Wednesday, January 1, 2014 | 387700000 | 410400000 |
| Thursday, January 1, 2015 | 423600000 | 408700000 |
| Friday, January 1, 2016 | 490800000 | 489000000 |
| Sunday, January 1, 2017 | 562900000 | 503200000 |
| Monday, January 1, 2018 | 575200000 | 149800000 |
| Tuesday, January 1, 2019 | 633300000 | 580600000 |
| Wednesday, January 1, 2020 | 553900000 | 581000000 |
| Friday, January 1, 2021 | 652500000 | 656000000 |
| Saturday, January 1, 2022 | 729000000 | 767000000 |
| Sunday, January 1, 2023 | 879500000 | 1157000000 |
| Monday, January 1, 2024 | 1034800000 |
Cracking the code
In the ever-evolving landscape of global business, Lennox International Inc. and Rentokil Initial plc stand as titans in their respective industries. Over the past decade, these companies have showcased remarkable EBITDA growth, reflecting their strategic prowess and market adaptability.
From 2014 to 2023, Lennox International Inc. demonstrated a robust upward trajectory, with EBITDA increasing by approximately 167%. This growth underscores their commitment to innovation and operational efficiency. Meanwhile, Rentokil Initial plc also exhibited impressive gains, with a 182% rise in EBITDA over the same period, highlighting their strategic expansions and acquisitions.
The year 2023 marked a significant milestone, with Rentokil Initial plc achieving its highest EBITDA, surpassing Lennox International Inc. by 31%. However, data for 2024 remains incomplete, leaving room for speculation on future trends. As these industry leaders continue to evolve, their financial performance offers valuable insights into the dynamics of global business.
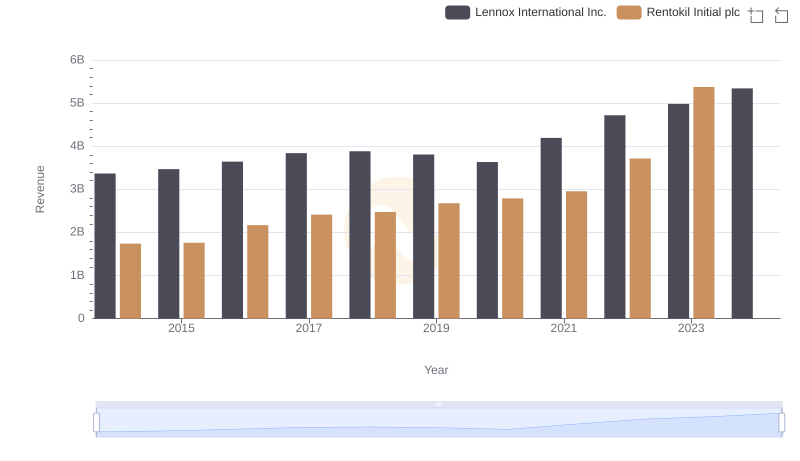
Annual Revenue Comparison: Lennox International Inc. vs Rentokil Initial plc
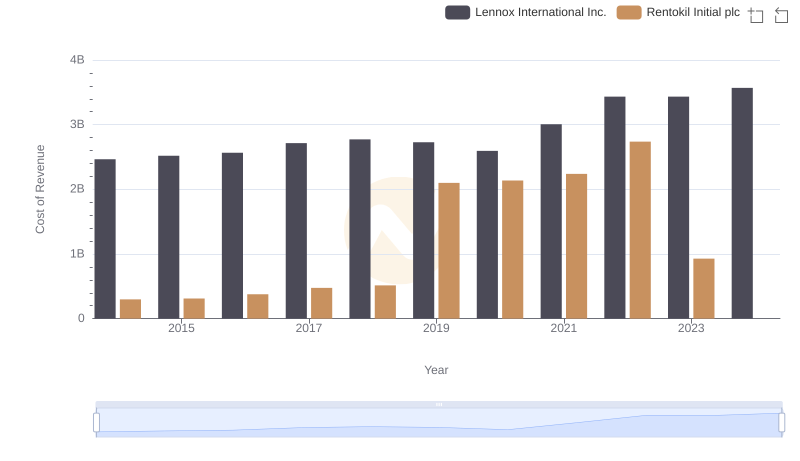
Cost Insights: Breaking Down Lennox International Inc. and Rentokil Initial plc's Expenses
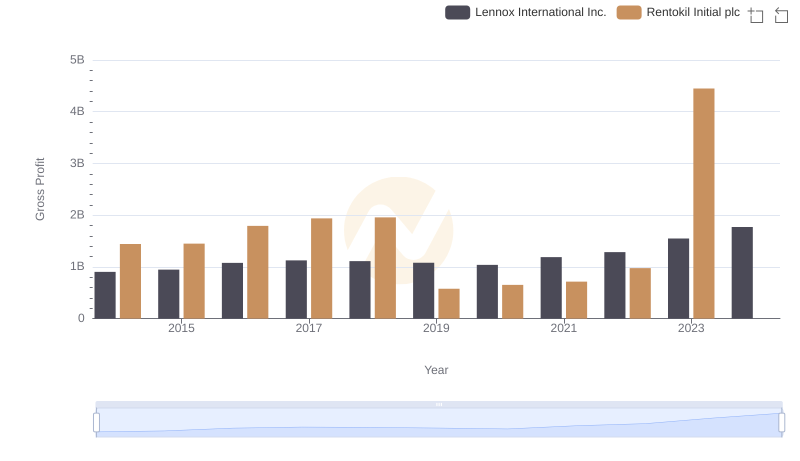
Gross Profit Comparison: Lennox International Inc. and Rentokil Initial plc Trends
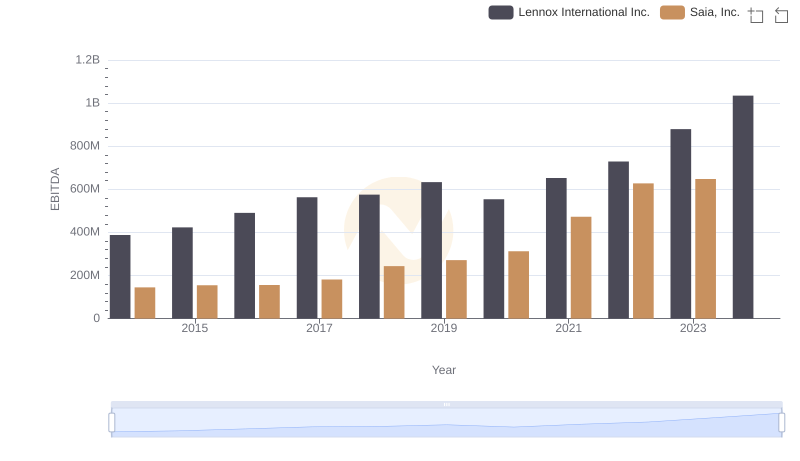
Comprehensive EBITDA Comparison: Lennox International Inc. vs Saia, Inc.
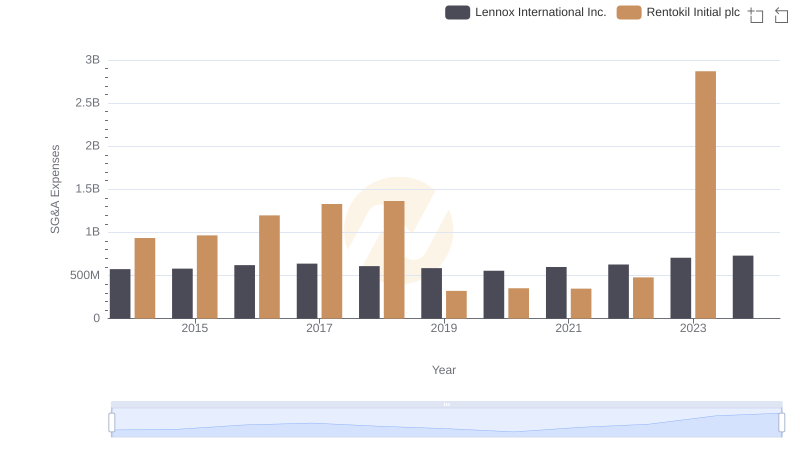
Who Optimizes SG&A Costs Better? Lennox International Inc. or Rentokil Initial plc
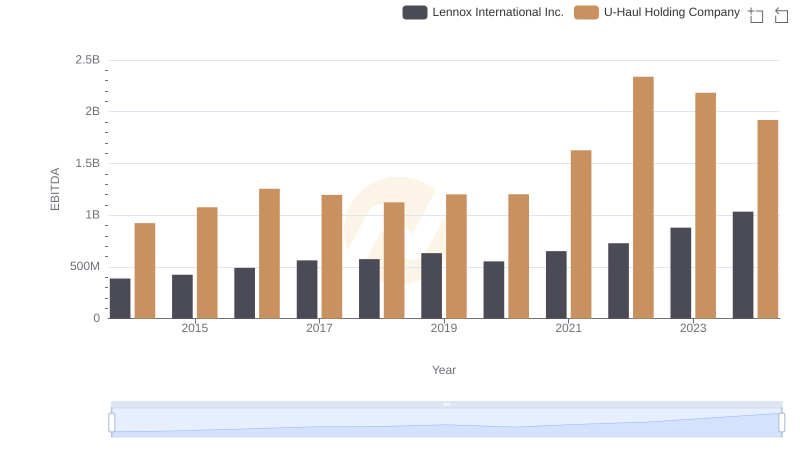
A Professional Review of EBITDA: Lennox International Inc. Compared to U-Haul Holding Company
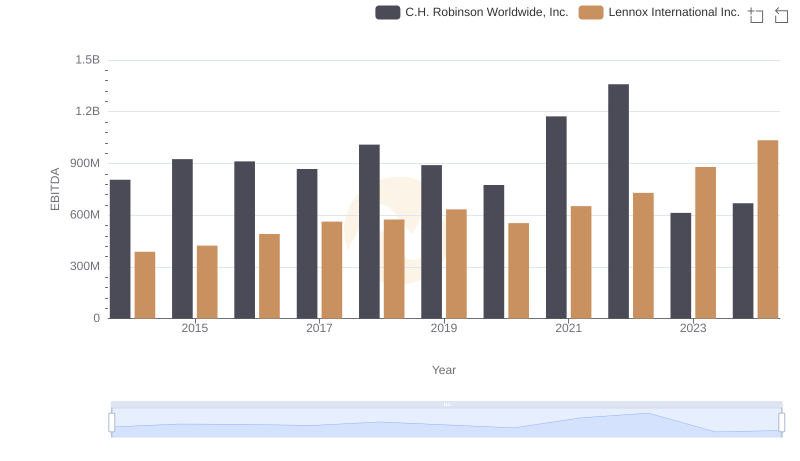
A Professional Review of EBITDA: Lennox International Inc. Compared to C.H. Robinson Worldwide, Inc.
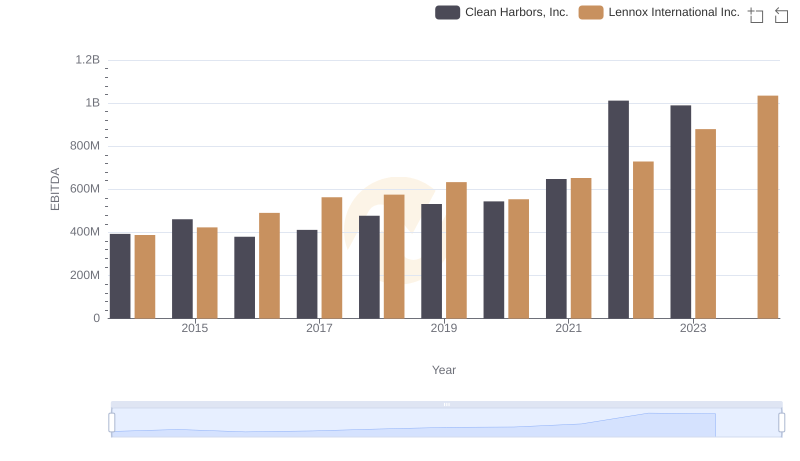
Comparative EBITDA Analysis: Lennox International Inc. vs Clean Harbors, Inc.
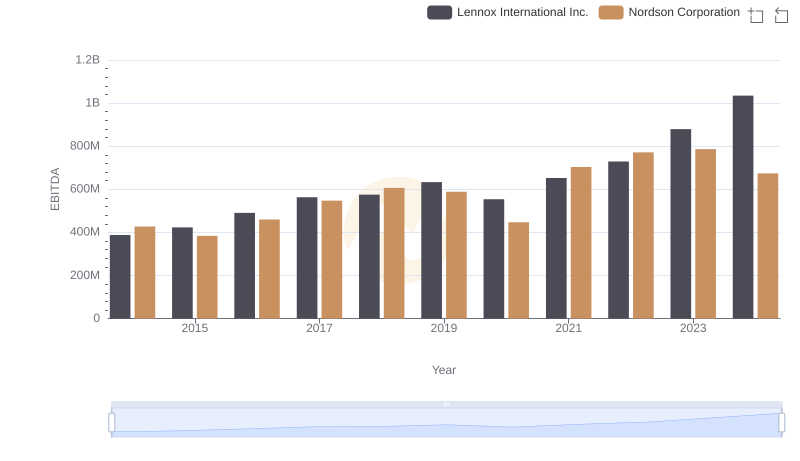
Lennox International Inc. vs Nordson Corporation: In-Depth EBITDA Performance Comparison

Professional EBITDA Benchmarking: Lennox International Inc. vs Curtiss-Wright Corporation
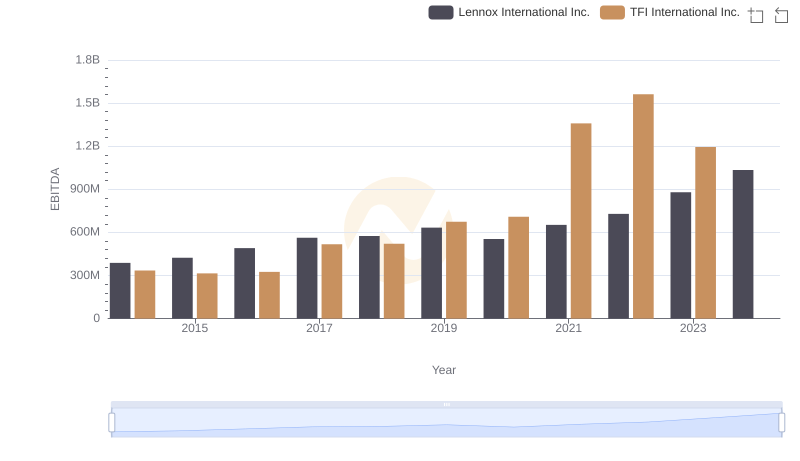
A Professional Review of EBITDA: Lennox International Inc. Compared to TFI International Inc.
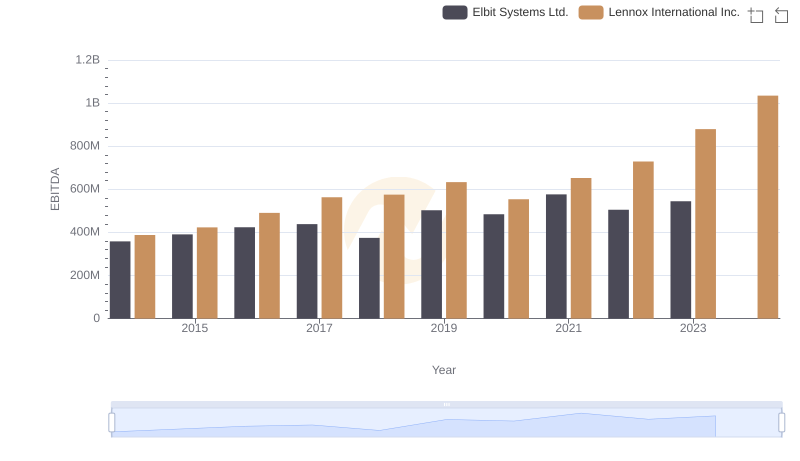
Professional EBITDA Benchmarking: Lennox International Inc. vs Elbit Systems Ltd.