| __timestamp | Clean Harbors, Inc. | Lennox International Inc. |
|---|---|---|
| Wednesday, January 1, 2014 | 393092000 | 387700000 |
| Thursday, January 1, 2015 | 461019000 | 423600000 |
| Friday, January 1, 2016 | 380027000 | 490800000 |
| Sunday, January 1, 2017 | 411975000 | 562900000 |
| Monday, January 1, 2018 | 477159000 | 575200000 |
| Tuesday, January 1, 2019 | 531861000 | 633300000 |
| Wednesday, January 1, 2020 | 544047000 | 553900000 |
| Friday, January 1, 2021 | 647725000 | 652500000 |
| Saturday, January 1, 2022 | 1011488000 | 729000000 |
| Sunday, January 1, 2023 | 989565000 | 879500000 |
| Monday, January 1, 2024 | 799401000 | 1034800000 |
Unleashing insights
In the competitive landscape of industrial giants, Lennox International Inc. and Clean Harbors, Inc. have showcased remarkable EBITDA growth over the past decade. From 2014 to 2023, Clean Harbors, Inc. saw its EBITDA surge by approximately 152%, peaking in 2022. Meanwhile, Lennox International Inc. demonstrated a steady climb, with a notable 127% increase, reaching its highest in 2024.
The year 2022 marked a significant milestone for Clean Harbors, Inc., as it surpassed Lennox International Inc. in EBITDA for the first time in this period. However, Lennox International Inc. rebounded in 2024, achieving its highest EBITDA yet, despite missing data for Clean Harbors, Inc. in the same year. This dynamic rivalry highlights the resilience and strategic prowess of both companies in navigating economic challenges and capitalizing on growth opportunities.
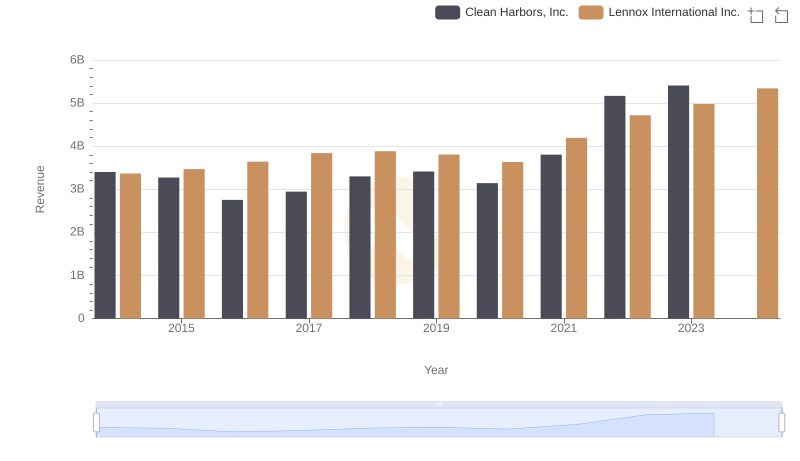
Comparing Revenue Performance: Lennox International Inc. or Clean Harbors, Inc.?
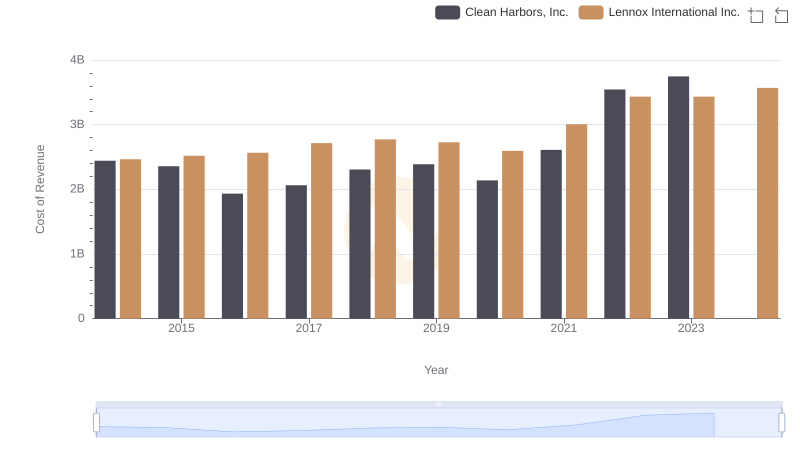
Cost of Revenue Comparison: Lennox International Inc. vs Clean Harbors, Inc.
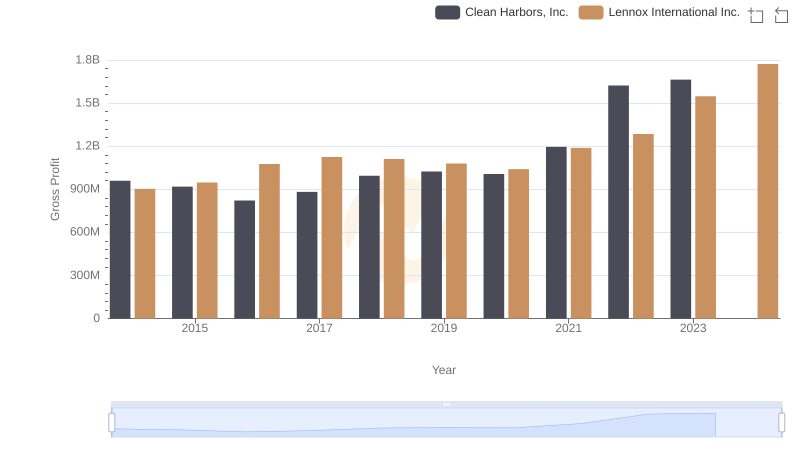
Gross Profit Trends Compared: Lennox International Inc. vs Clean Harbors, Inc.

Professional EBITDA Benchmarking: Lennox International Inc. vs Stanley Black & Decker, Inc.
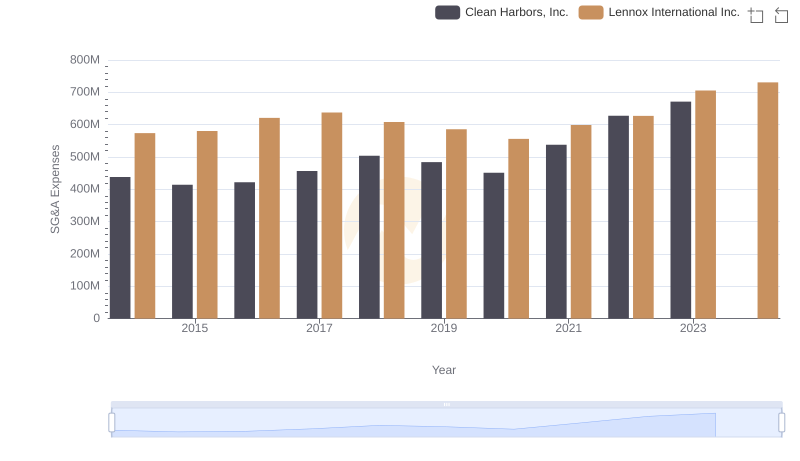
Lennox International Inc. and Clean Harbors, Inc.: SG&A Spending Patterns Compared
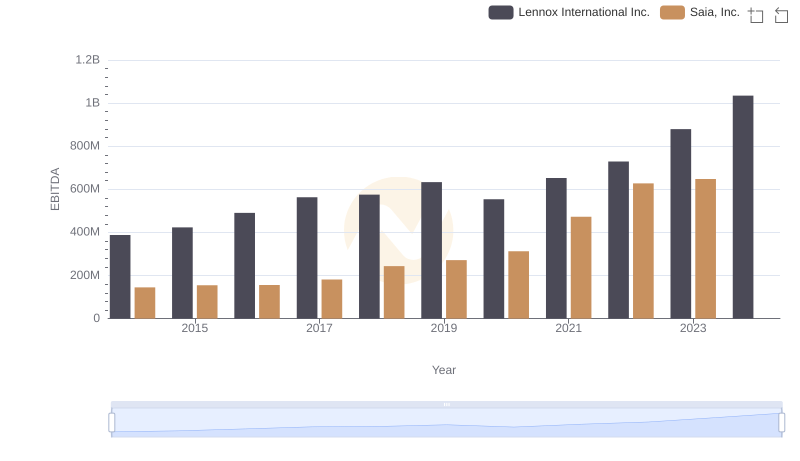
Comprehensive EBITDA Comparison: Lennox International Inc. vs Saia, Inc.
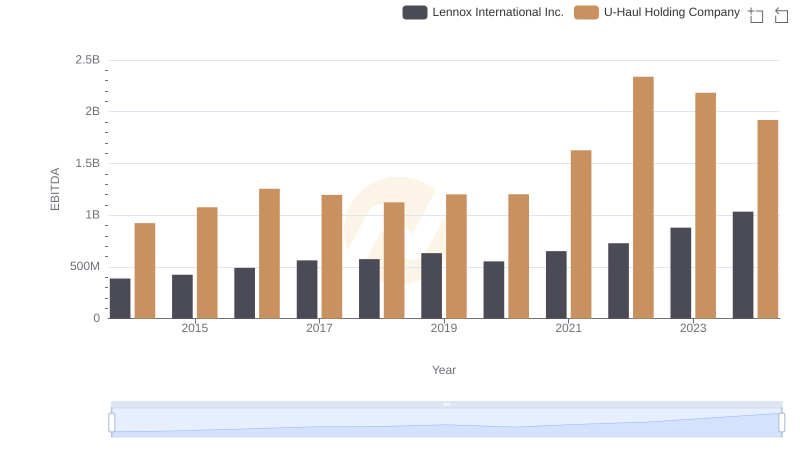
A Professional Review of EBITDA: Lennox International Inc. Compared to U-Haul Holding Company
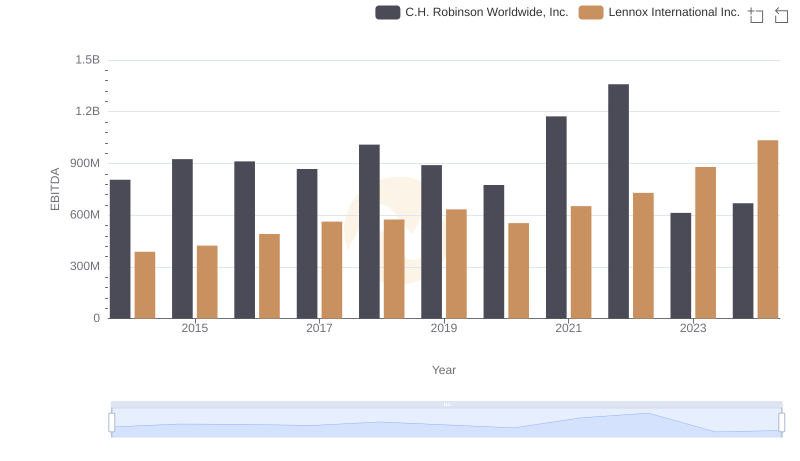
A Professional Review of EBITDA: Lennox International Inc. Compared to C.H. Robinson Worldwide, Inc.
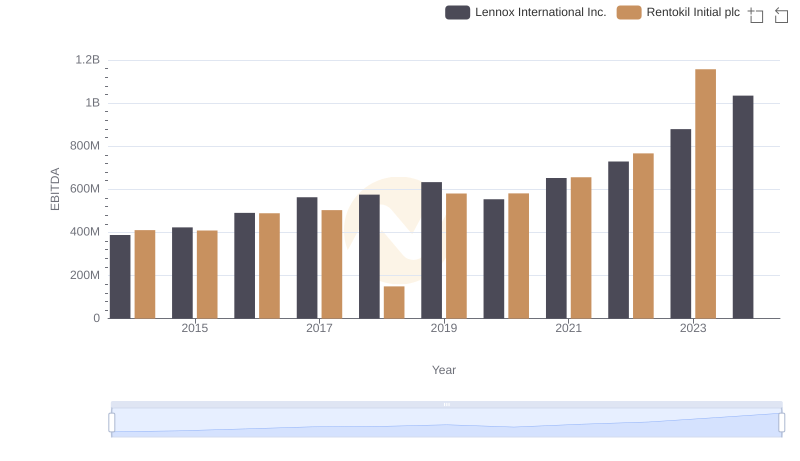
Lennox International Inc. vs Rentokil Initial plc: In-Depth EBITDA Performance Comparison
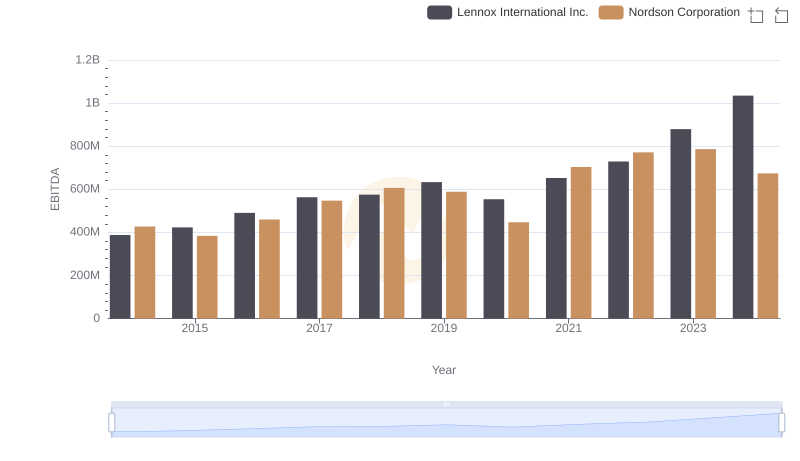
Lennox International Inc. vs Nordson Corporation: In-Depth EBITDA Performance Comparison
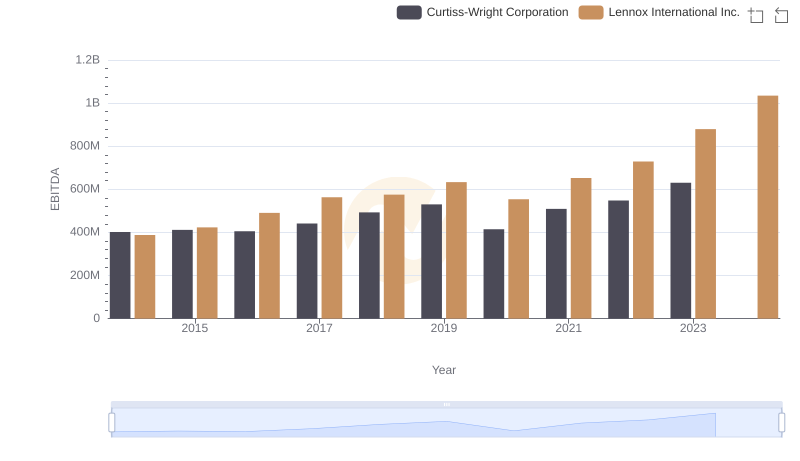
Professional EBITDA Benchmarking: Lennox International Inc. vs Curtiss-Wright Corporation
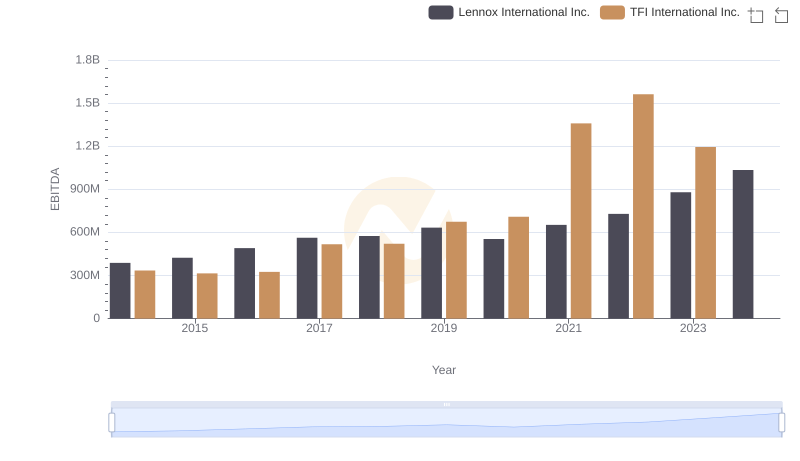
A Professional Review of EBITDA: Lennox International Inc. Compared to TFI International Inc.