| __timestamp | Lennox International Inc. | Saia, Inc. |
|---|---|---|
| Wednesday, January 1, 2014 | 2464100000 | 1113053000 |
| Thursday, January 1, 2015 | 2520000000 | 1067191000 |
| Friday, January 1, 2016 | 2565100000 | 1058979000 |
| Sunday, January 1, 2017 | 2714400000 | 1203464000 |
| Monday, January 1, 2018 | 2772700000 | 1423779000 |
| Tuesday, January 1, 2019 | 2727400000 | 1537082000 |
| Wednesday, January 1, 2020 | 2594000000 | 1538518000 |
| Friday, January 1, 2021 | 3005700000 | 1837017000 |
| Saturday, January 1, 2022 | 3433700000 | 2201094000 |
| Sunday, January 1, 2023 | 3434100000 | 2282501000 |
| Monday, January 1, 2024 | 3569400000 |
In pursuit of knowledge
In the ever-evolving landscape of industrial giants, understanding cost structures is pivotal. Lennox International Inc. and Saia, Inc., two stalwarts in their respective sectors, offer intriguing insights into their financial journeys from 2014 to 2023. Lennox International Inc. has seen a steady increase in its cost of revenue, growing by approximately 45% over the decade, peaking at $3.57 billion in 2024. This reflects a robust expansion strategy and increased operational scale. Meanwhile, Saia, Inc. has demonstrated a remarkable 105% growth in its cost of revenue, reaching $2.28 billion by 2023, underscoring its aggressive market penetration and scaling efforts. Notably, data for 2024 is missing for Saia, Inc., hinting at potential strategic shifts or reporting delays. This comparative analysis highlights the dynamic nature of cost management in the industrial sector, offering valuable insights for investors and analysts alike.
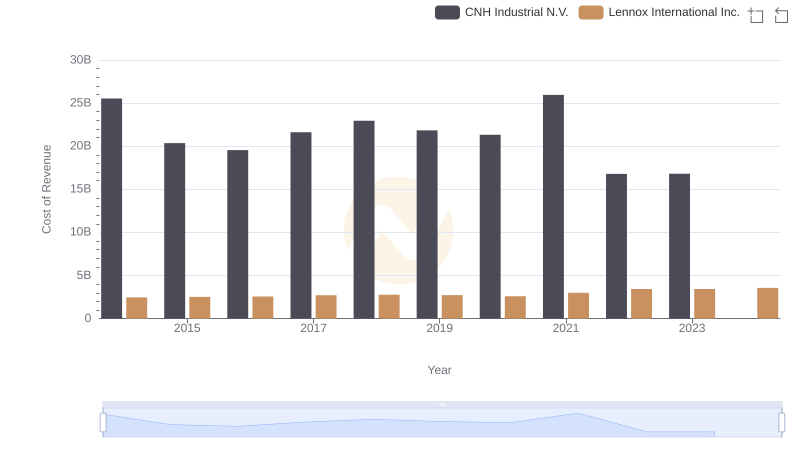
Cost of Revenue Trends: Lennox International Inc. vs CNH Industrial N.V.
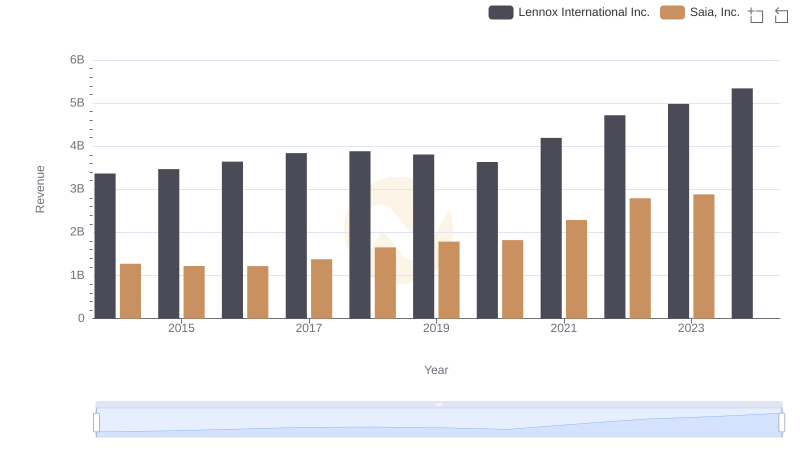
Revenue Insights: Lennox International Inc. and Saia, Inc. Performance Compared
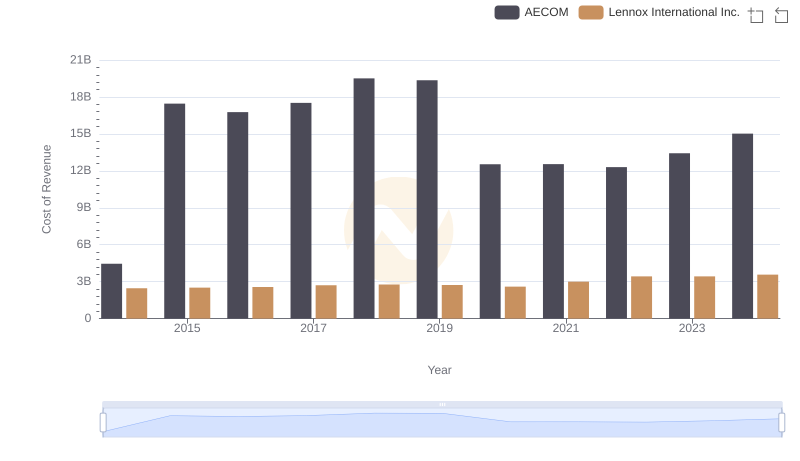
Cost of Revenue Trends: Lennox International Inc. vs AECOM
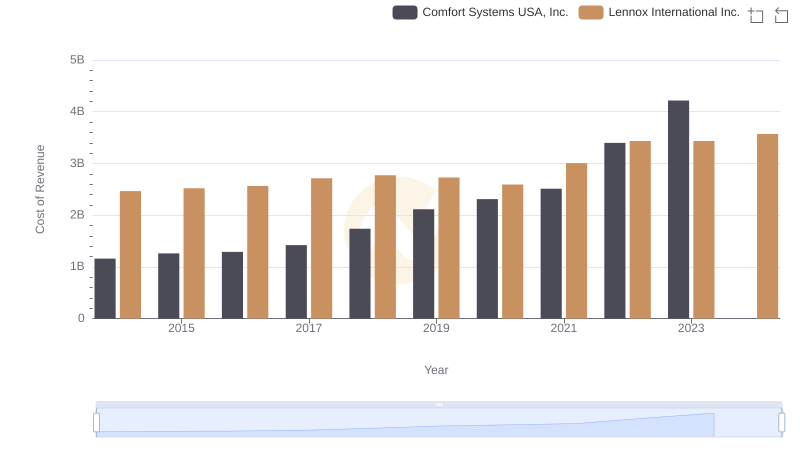
Cost of Revenue Trends: Lennox International Inc. vs Comfort Systems USA, Inc.
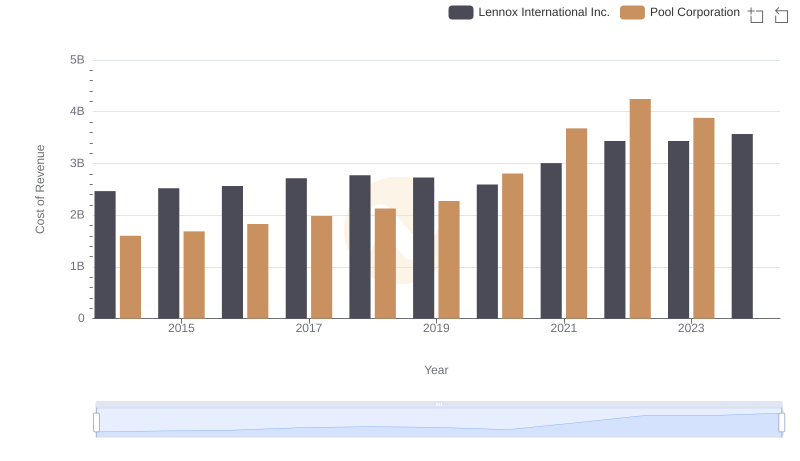
Comparing Cost of Revenue Efficiency: Lennox International Inc. vs Pool Corporation
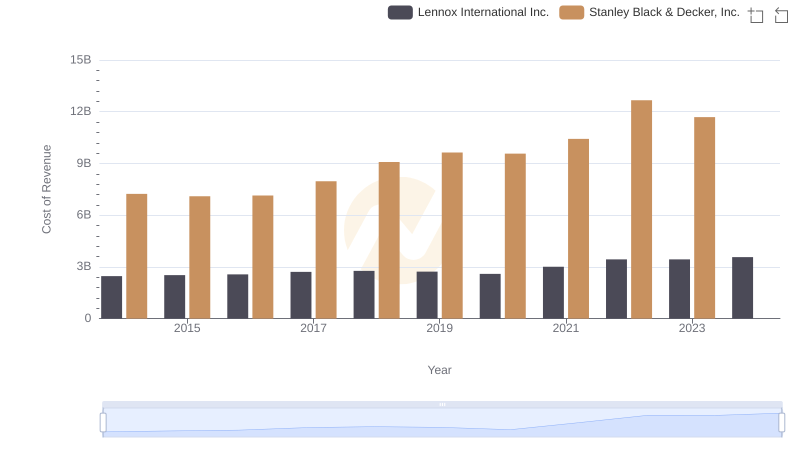
Analyzing Cost of Revenue: Lennox International Inc. and Stanley Black & Decker, Inc.
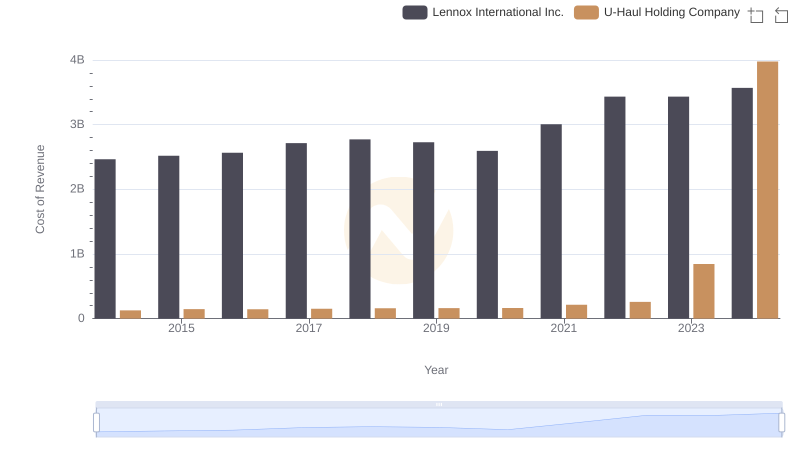
Cost Insights: Breaking Down Lennox International Inc. and U-Haul Holding Company's Expenses
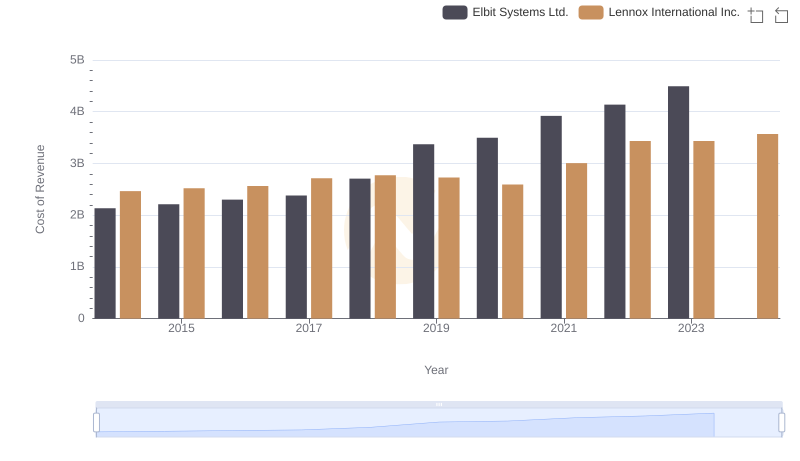
Cost of Revenue: Key Insights for Lennox International Inc. and Elbit Systems Ltd.
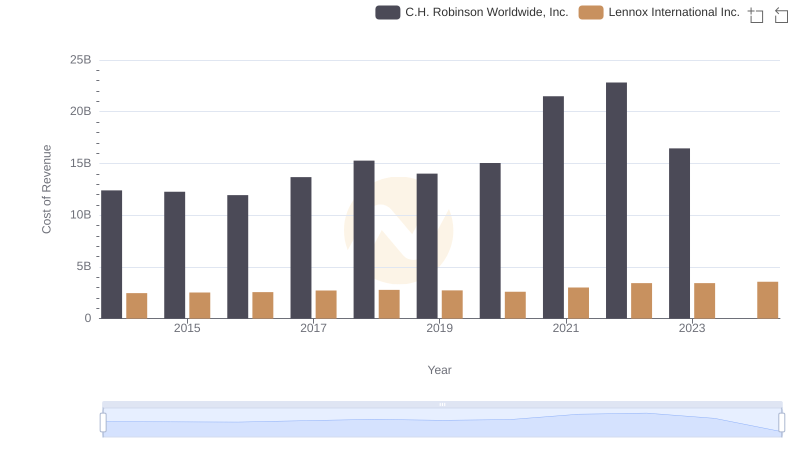
Cost of Revenue: Key Insights for Lennox International Inc. and C.H. Robinson Worldwide, Inc.
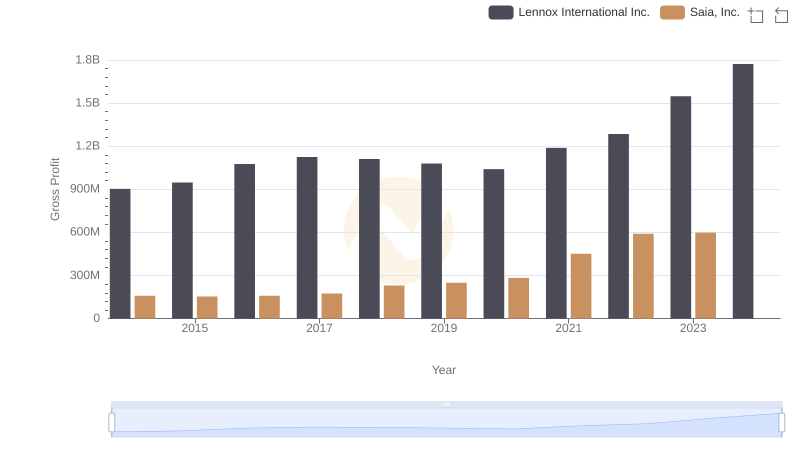
Gross Profit Trends Compared: Lennox International Inc. vs Saia, Inc.

Lennox International Inc. vs Saia, Inc.: SG&A Expense Trends
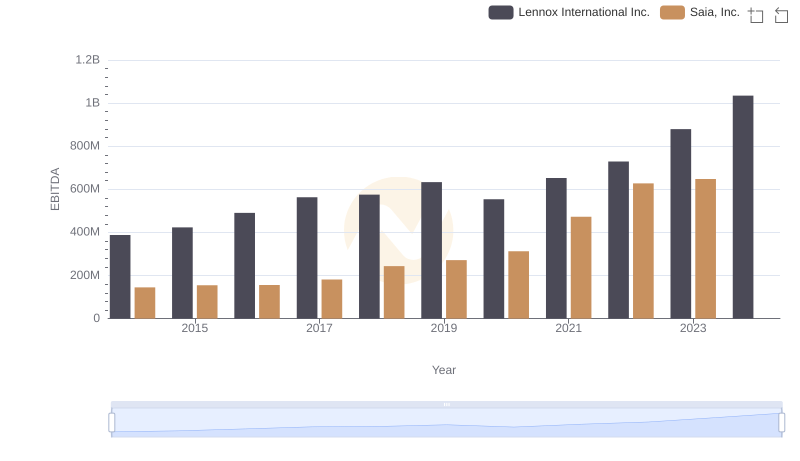
Comprehensive EBITDA Comparison: Lennox International Inc. vs Saia, Inc.