| __timestamp | CNH Industrial N.V. | Lennox International Inc. |
|---|---|---|
| Wednesday, January 1, 2014 | 1106000000 | 60700000 |
| Thursday, January 1, 2015 | 856000000 | 62300000 |
| Friday, January 1, 2016 | 860000000 | 64599999 |
| Sunday, January 1, 2017 | 957000000 | 73600000 |
| Monday, January 1, 2018 | 1061000000 | 72200000 |
| Tuesday, January 1, 2019 | 1030000000 | 69900000 |
| Wednesday, January 1, 2020 | 932000000 | 66800000 |
| Friday, January 1, 2021 | 1236000000 | 76100000 |
| Saturday, January 1, 2022 | 866000000 | 80300000 |
| Sunday, January 1, 2023 | 1041000000 | 94000000 |
| Monday, January 1, 2024 | 0 |
Unleashing insights
In the ever-evolving landscape of industrial innovation, research and development (R&D) spending is a key indicator of a company's commitment to future growth. Over the past decade, CNH Industrial N.V. and Lennox International Inc. have demonstrated contrasting approaches to R&D investment. From 2014 to 2023, CNH Industrial consistently allocated a significant portion of its resources to R&D, peaking in 2021 with a 24% increase from the previous year. In contrast, Lennox International's R&D spending, while steadily increasing, remains a fraction of CNH's, with its highest expenditure in 2023, marking a 55% rise since 2014.
This disparity highlights CNH Industrial's aggressive pursuit of innovation, while Lennox International adopts a more conservative strategy. As we look to the future, these trends may shape the competitive dynamics within their respective industries, underscoring the importance of strategic investment in innovation.
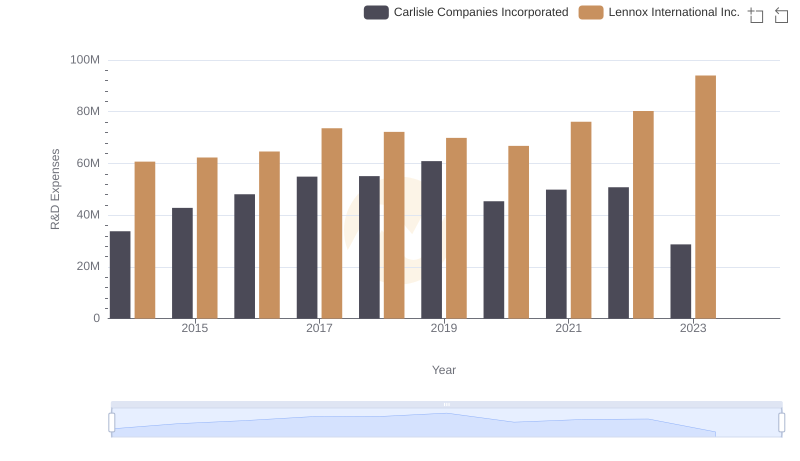
Analyzing R&D Budgets: Lennox International Inc. vs Carlisle Companies Incorporated
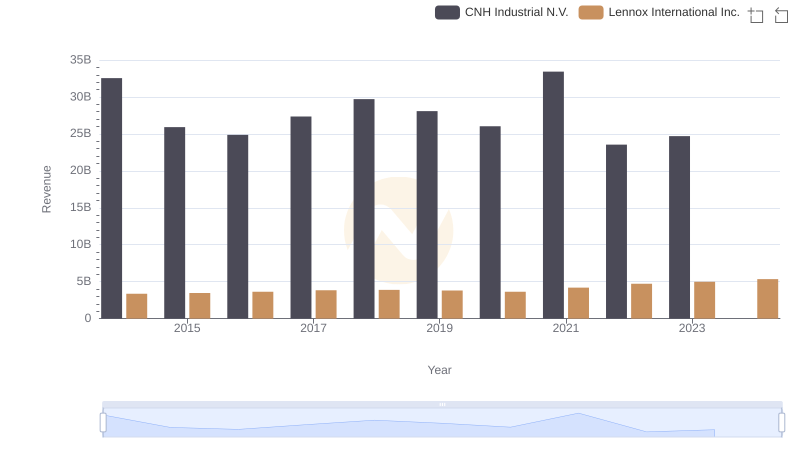
Lennox International Inc. and CNH Industrial N.V.: A Comprehensive Revenue Analysis
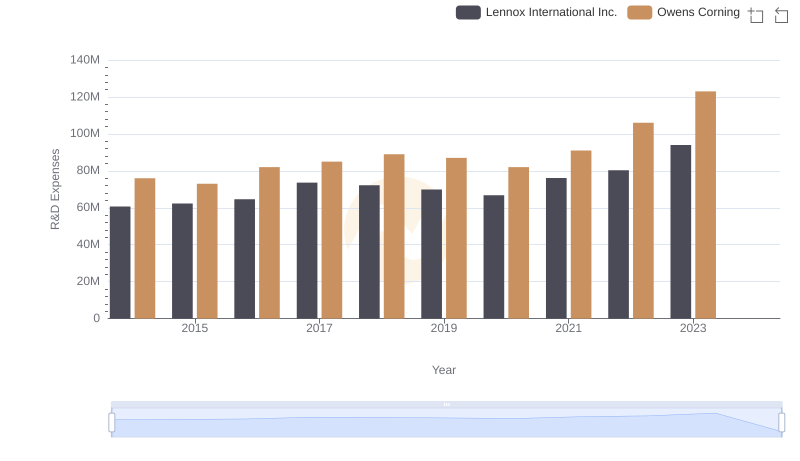
Research and Development: Comparing Key Metrics for Lennox International Inc. and Owens Corning
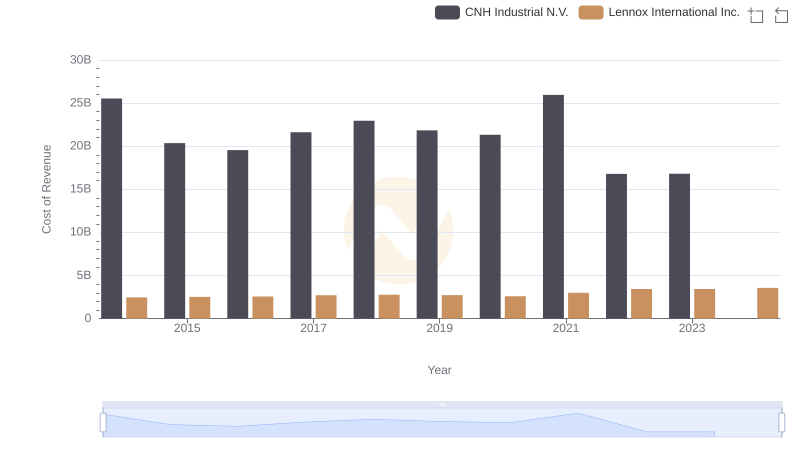
Cost of Revenue Trends: Lennox International Inc. vs CNH Industrial N.V.
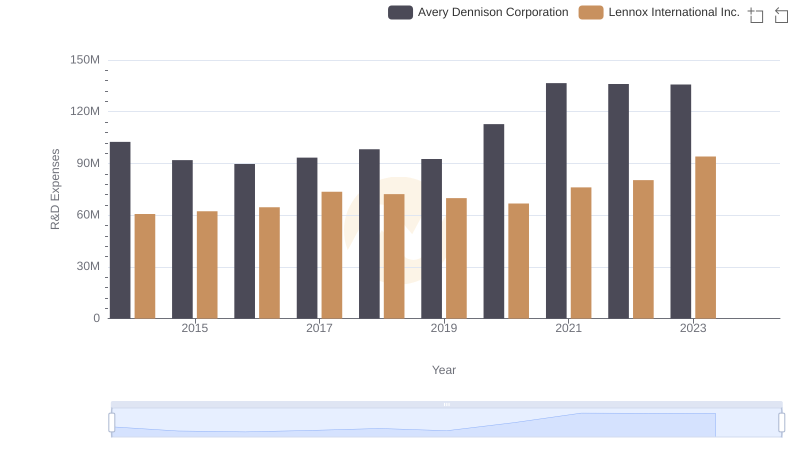
Lennox International Inc. or Avery Dennison Corporation: Who Invests More in Innovation?
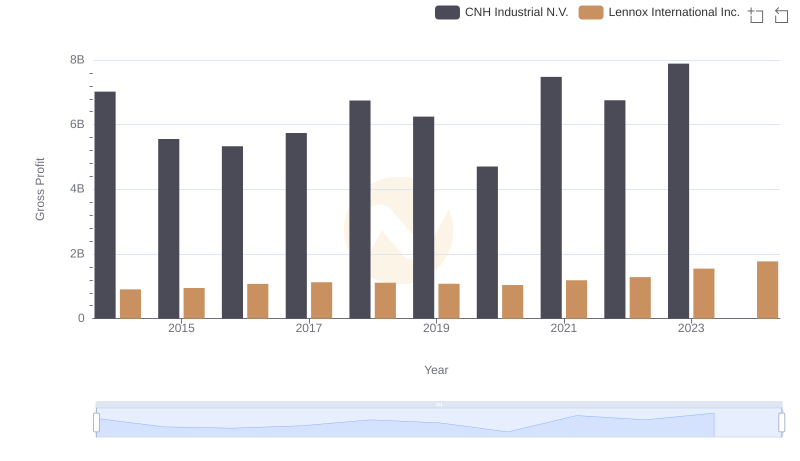
Lennox International Inc. and CNH Industrial N.V.: A Detailed Gross Profit Analysis
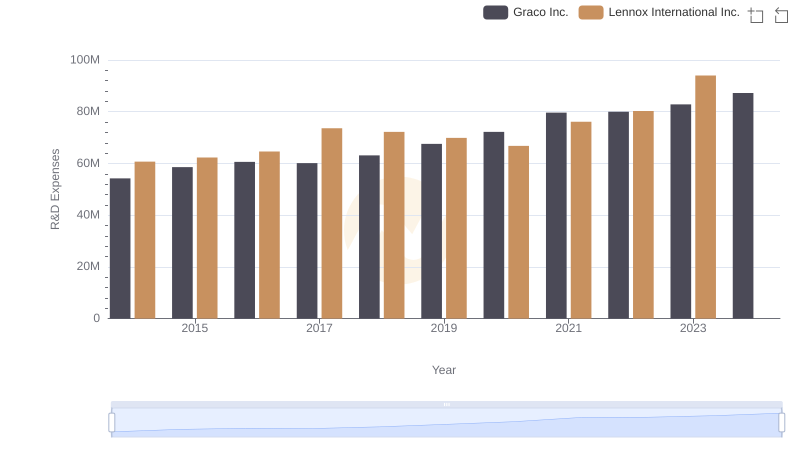
Lennox International Inc. or Graco Inc.: Who Invests More in Innovation?
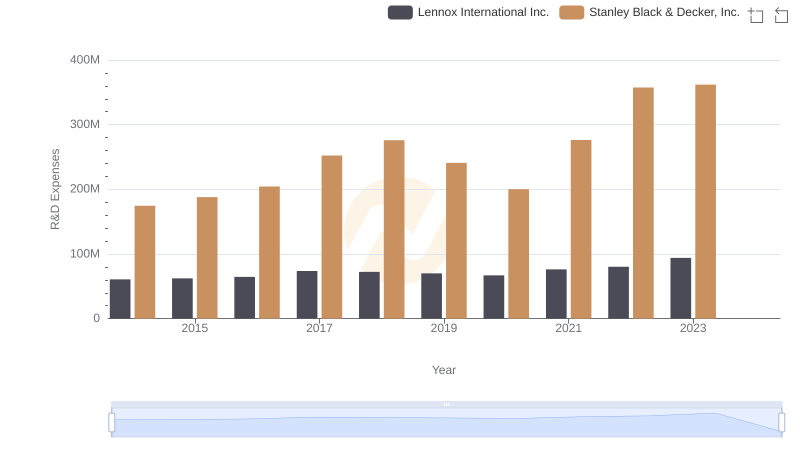
Research and Development: Comparing Key Metrics for Lennox International Inc. and Stanley Black & Decker, Inc.
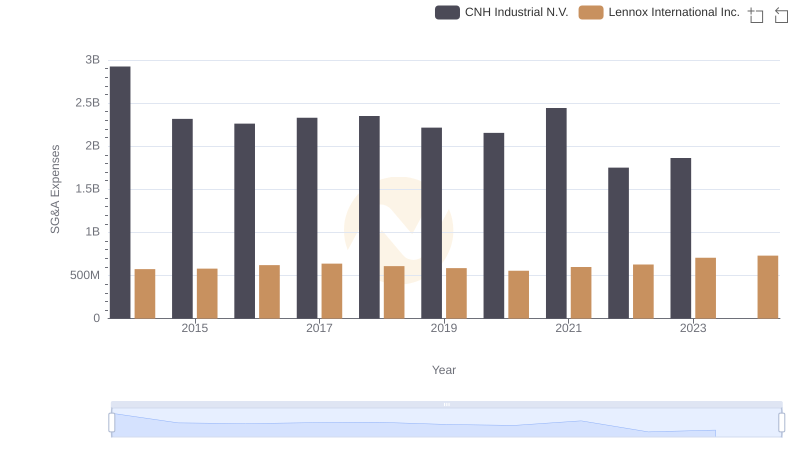
Breaking Down SG&A Expenses: Lennox International Inc. vs CNH Industrial N.V.
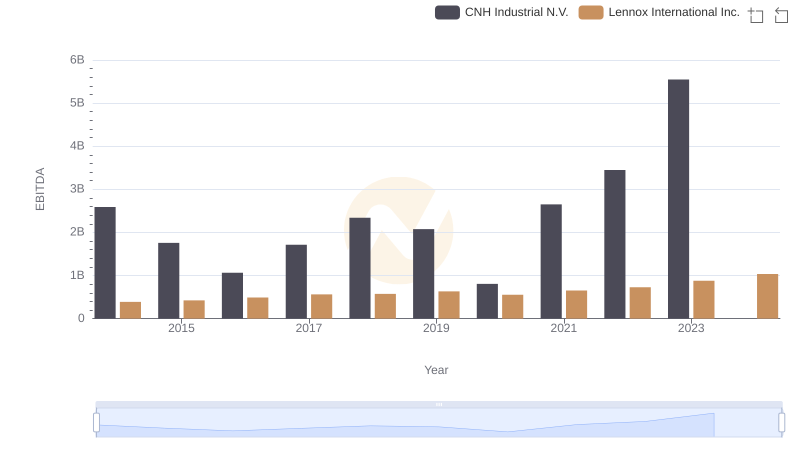
Comprehensive EBITDA Comparison: Lennox International Inc. vs CNH Industrial N.V.
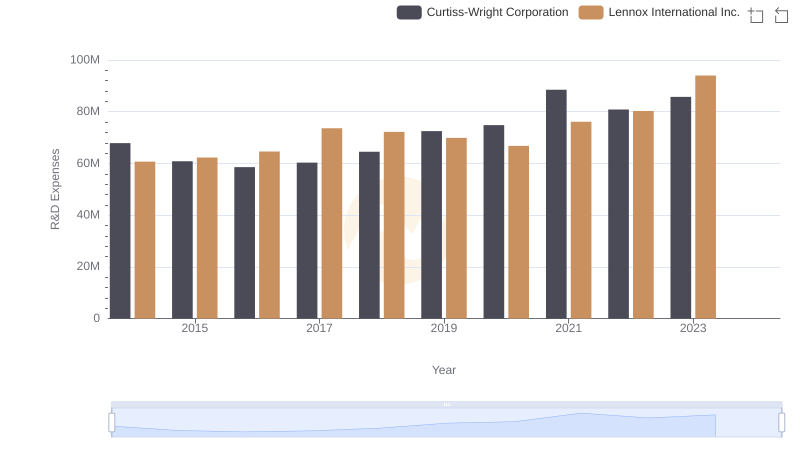
Research and Development Investment: Lennox International Inc. vs Curtiss-Wright Corporation
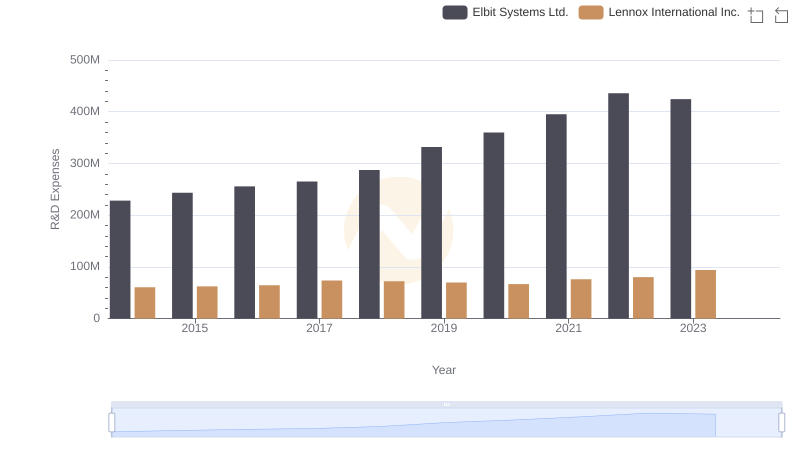
Lennox International Inc. vs Elbit Systems Ltd.: Strategic Focus on R&D Spending