| __timestamp | CNH Industrial N.V. | Lennox International Inc. |
|---|---|---|
| Wednesday, January 1, 2014 | 25534000000 | 2464100000 |
| Thursday, January 1, 2015 | 20357000000 | 2520000000 |
| Friday, January 1, 2016 | 19539000000 | 2565100000 |
| Sunday, January 1, 2017 | 21621000000 | 2714400000 |
| Monday, January 1, 2018 | 22958000000 | 2772700000 |
| Tuesday, January 1, 2019 | 21832000000 | 2727400000 |
| Wednesday, January 1, 2020 | 21327000000 | 2594000000 |
| Friday, January 1, 2021 | 25951000000 | 3005700000 |
| Saturday, January 1, 2022 | 16797000000 | 3433700000 |
| Sunday, January 1, 2023 | 16805000000 | 3434100000 |
| Monday, January 1, 2024 | 3569400000 |
Unveiling the hidden dimensions of data
In the ever-evolving landscape of industrial manufacturing, Lennox International Inc. and CNH Industrial N.V. have carved distinct paths over the past decade. From 2014 to 2023, CNH Industrial's cost of revenue has seen a notable decline of approximately 34%, dropping from its peak in 2014. This trend reflects strategic cost management and possibly a shift in operational focus. In contrast, Lennox International has experienced a steady increase, with costs rising by about 39% over the same period, indicating expansion and increased production capabilities.
The year 2021 marked a significant peak for CNH Industrial, with costs reaching their highest since 2014, before a sharp decline in 2022. Meanwhile, Lennox International's costs have consistently climbed, reaching their zenith in 2023. This divergence highlights differing strategies and market responses, offering a fascinating glimpse into the industrial sector's dynamics.
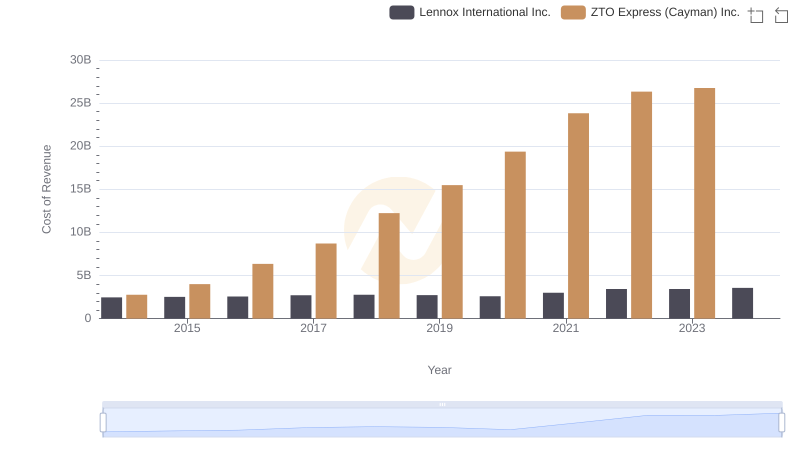
Lennox International Inc. vs ZTO Express (Cayman) Inc.: Efficiency in Cost of Revenue Explored
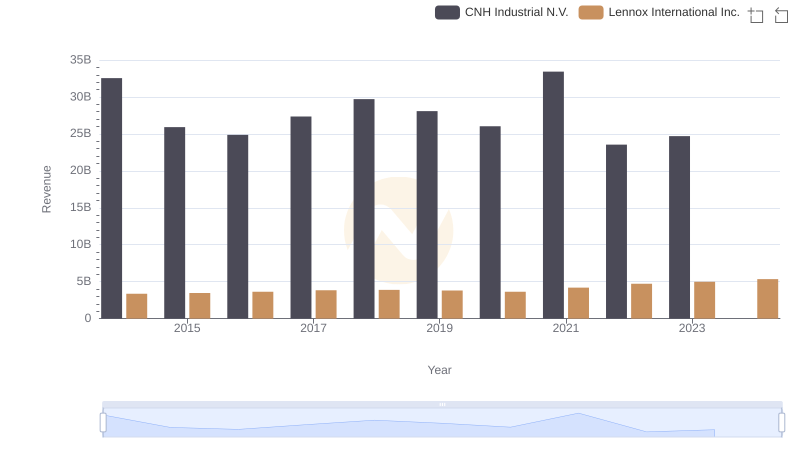
Lennox International Inc. and CNH Industrial N.V.: A Comprehensive Revenue Analysis
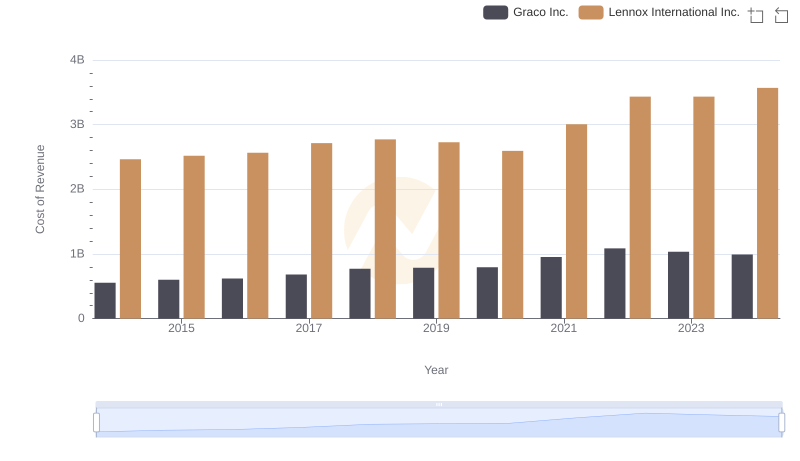
Cost of Revenue Comparison: Lennox International Inc. vs Graco Inc.
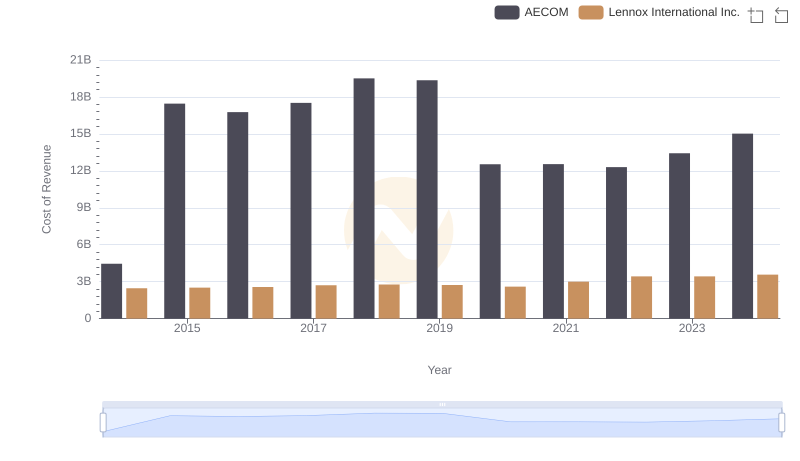
Cost of Revenue Trends: Lennox International Inc. vs AECOM
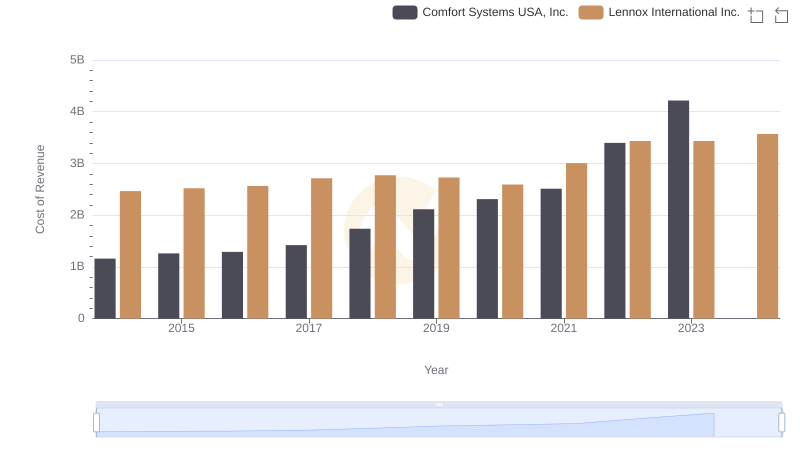
Cost of Revenue Trends: Lennox International Inc. vs Comfort Systems USA, Inc.
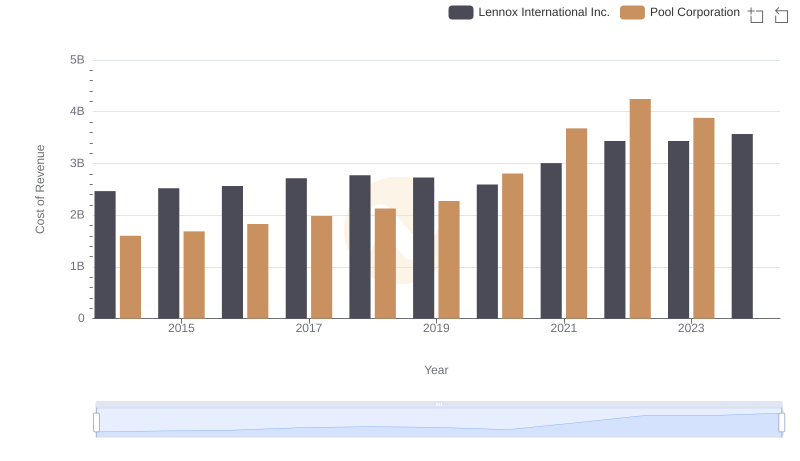
Comparing Cost of Revenue Efficiency: Lennox International Inc. vs Pool Corporation
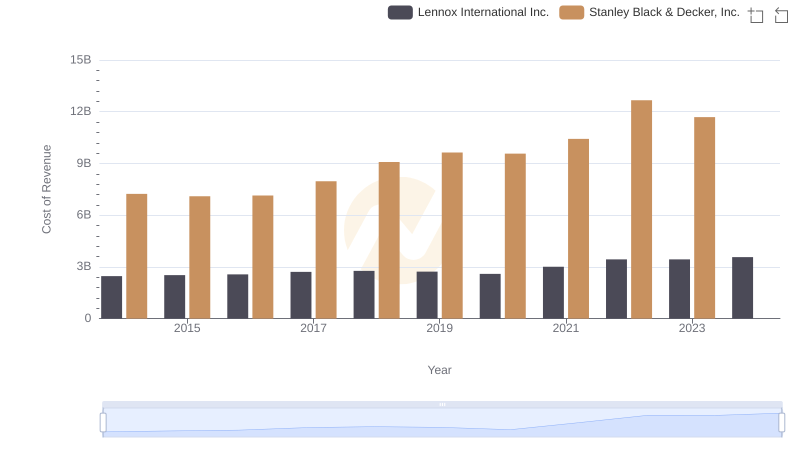
Analyzing Cost of Revenue: Lennox International Inc. and Stanley Black & Decker, Inc.
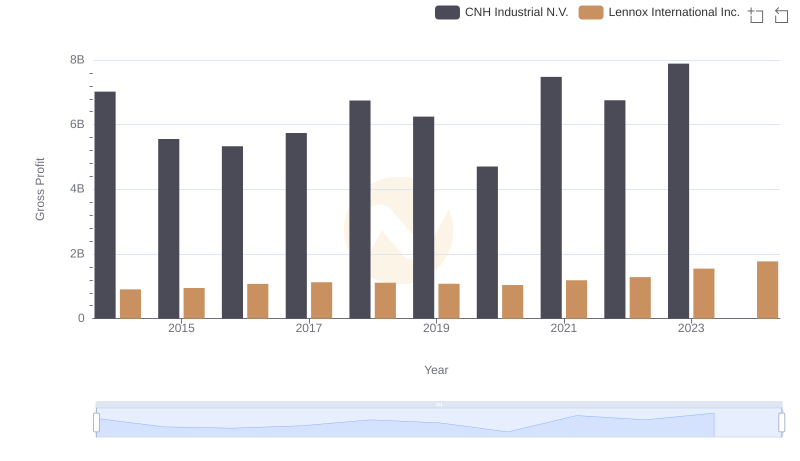
Lennox International Inc. and CNH Industrial N.V.: A Detailed Gross Profit Analysis
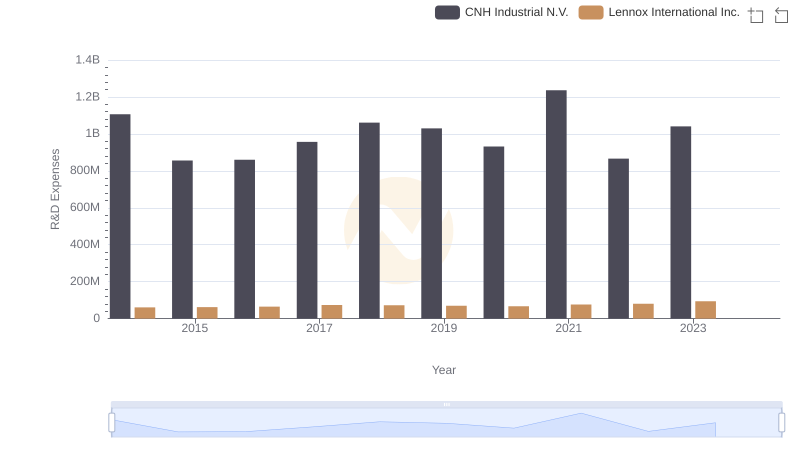
Comparing Innovation Spending: Lennox International Inc. and CNH Industrial N.V.
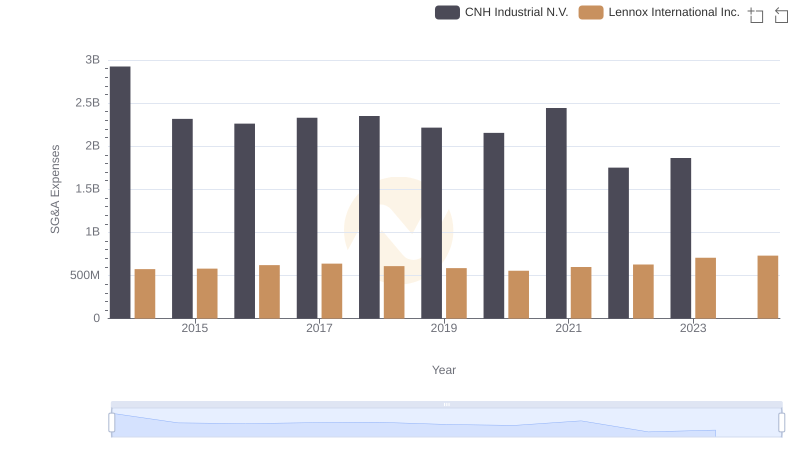
Breaking Down SG&A Expenses: Lennox International Inc. vs CNH Industrial N.V.
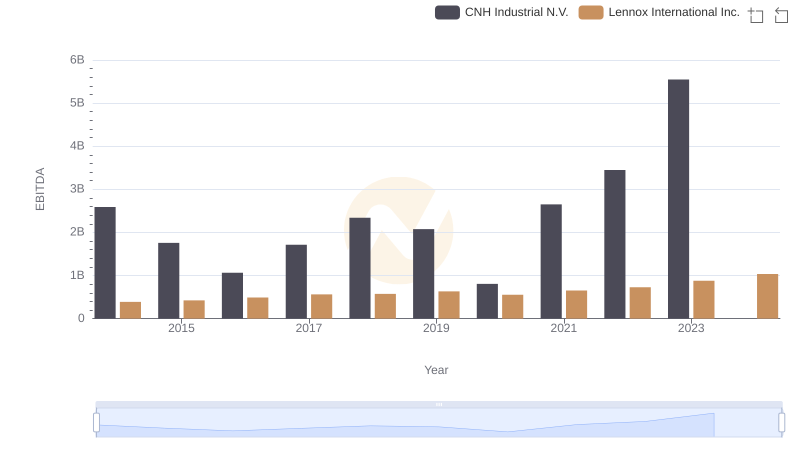
Comprehensive EBITDA Comparison: Lennox International Inc. vs CNH Industrial N.V.