| __timestamp | Global Payments Inc. | RB Global, Inc. |
|---|---|---|
| Wednesday, January 1, 2014 | 594102000 | 178851000 |
| Thursday, January 1, 2015 | 618109000 | 211417000 |
| Friday, January 1, 2016 | 748136000 | 174791291 |
| Sunday, January 1, 2017 | 1010019000 | 168379000 |
| Monday, January 1, 2018 | 1315968000 | 263653000 |
| Tuesday, January 1, 2019 | 1764994000 | 322140110 |
| Wednesday, January 1, 2020 | 2508393000 | 358617000 |
| Friday, January 1, 2021 | 3233589000 | 339928424 |
| Saturday, January 1, 2022 | 2427684000 | 557399151 |
| Sunday, January 1, 2023 | 3606789000 | 975874087 |
| Monday, January 1, 2024 | 2333605000 | 761100000 |
Unveiling the hidden dimensions of data
In the ever-evolving landscape of financial services, Global Payments Inc. and RB Global, Inc. have demonstrated remarkable EBITDA growth over the past decade. Since 2014, Global Payments Inc. has seen its EBITDA surge by over 500%, peaking in 2023. This growth reflects the company's strategic acquisitions and expansion into new markets. Meanwhile, RB Global, Inc. has also shown a steady increase, with its EBITDA nearly tripling during the same period, highlighting its resilience and adaptability in a competitive environment.
These trends underscore the dynamic nature of the financial sector and the importance of strategic growth initiatives.
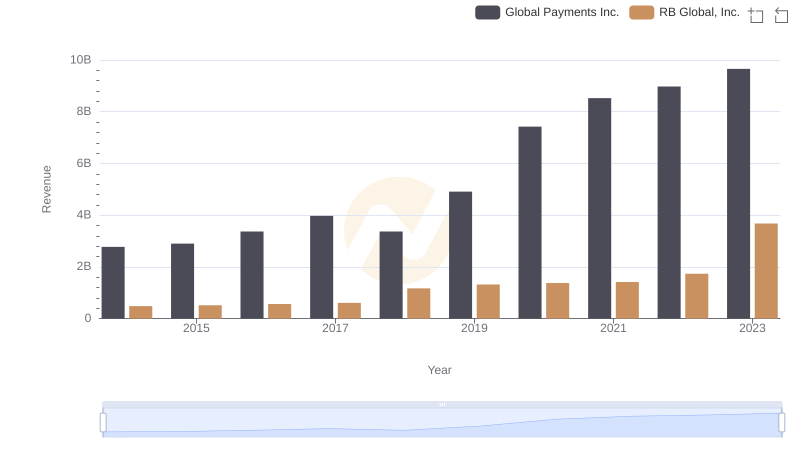
Comparing Revenue Performance: Global Payments Inc. or RB Global, Inc.?
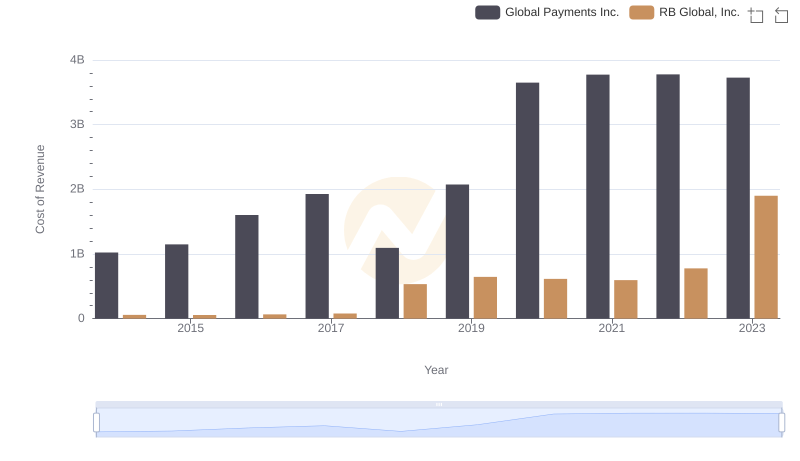
Cost of Revenue: Key Insights for Global Payments Inc. and RB Global, Inc.
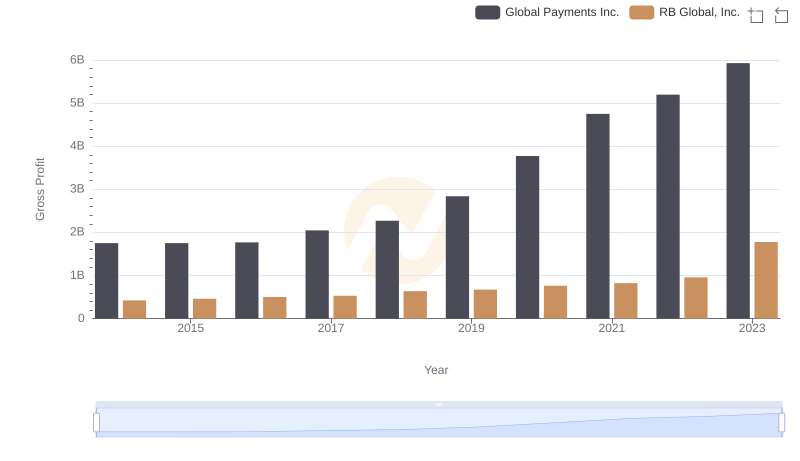
Gross Profit Comparison: Global Payments Inc. and RB Global, Inc. Trends
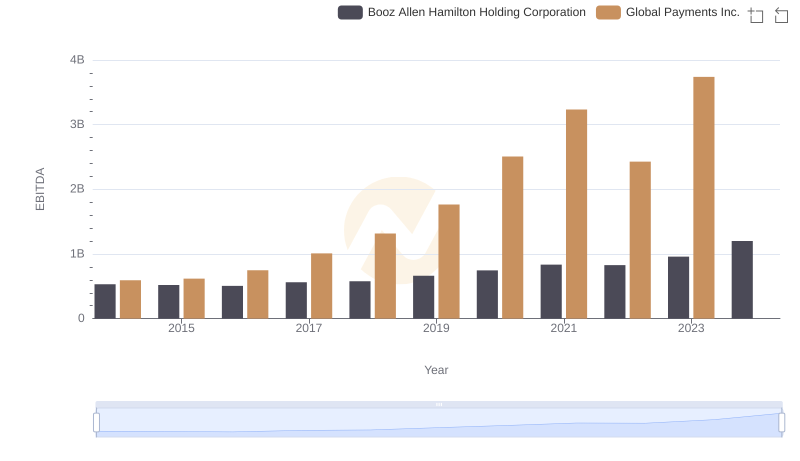
A Side-by-Side Analysis of EBITDA: Global Payments Inc. and Booz Allen Hamilton Holding Corporation
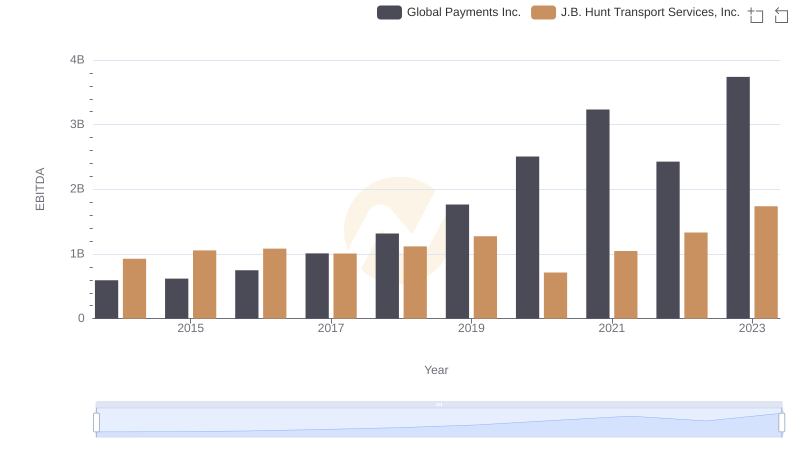
Comprehensive EBITDA Comparison: Global Payments Inc. vs J.B. Hunt Transport Services, Inc.
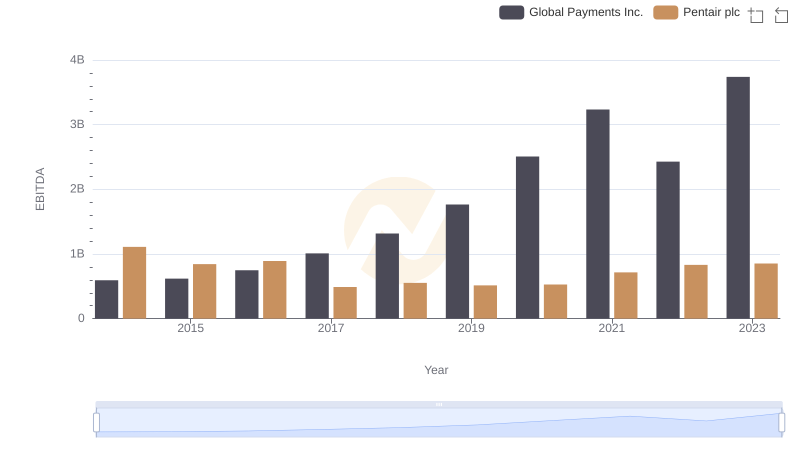
Professional EBITDA Benchmarking: Global Payments Inc. vs Pentair plc
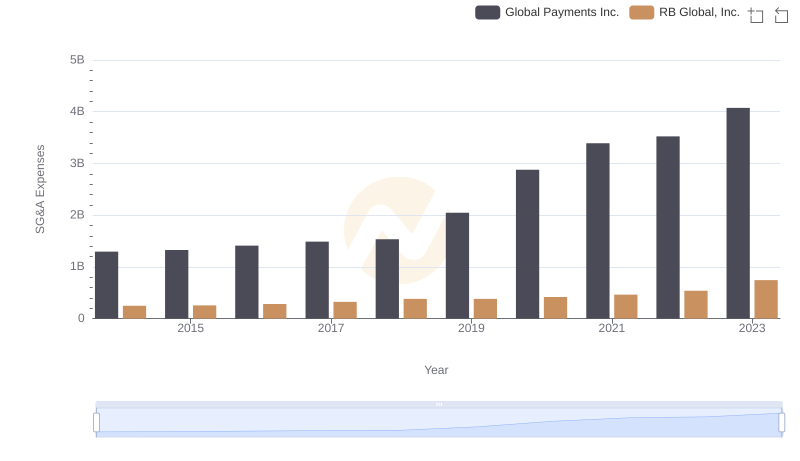
Cost Management Insights: SG&A Expenses for Global Payments Inc. and RB Global, Inc.
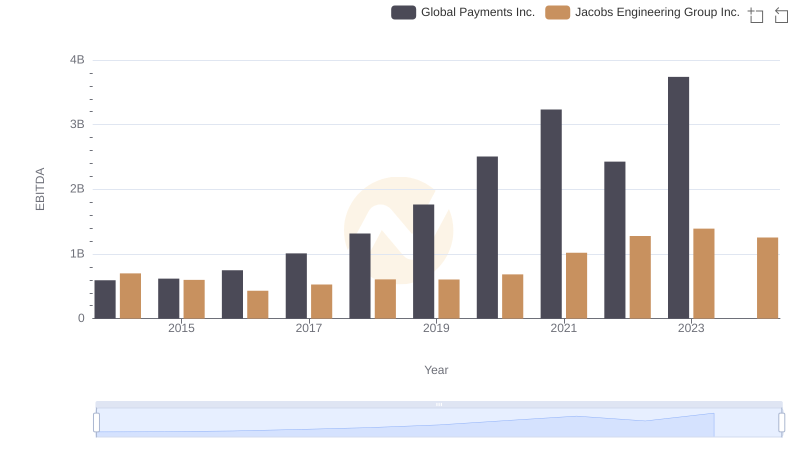
EBITDA Analysis: Evaluating Global Payments Inc. Against Jacobs Engineering Group Inc.
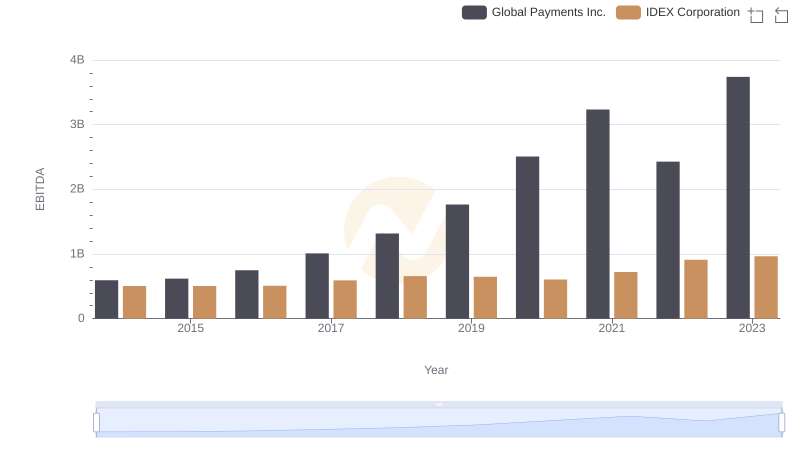
Global Payments Inc. vs IDEX Corporation: In-Depth EBITDA Performance Comparison
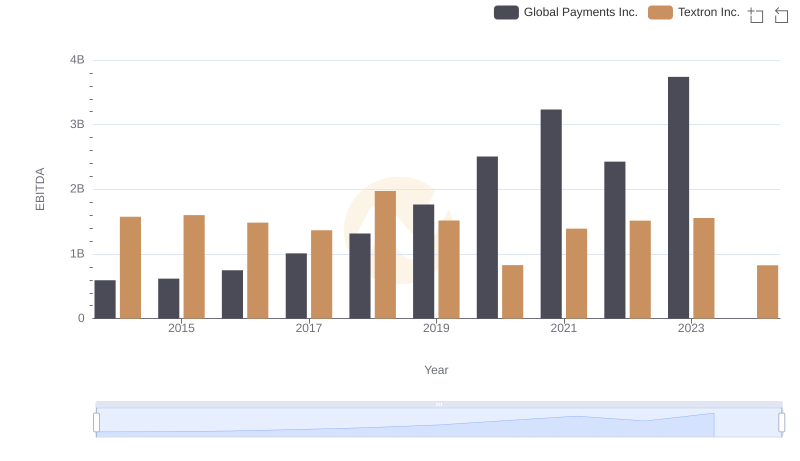
EBITDA Analysis: Evaluating Global Payments Inc. Against Textron Inc.
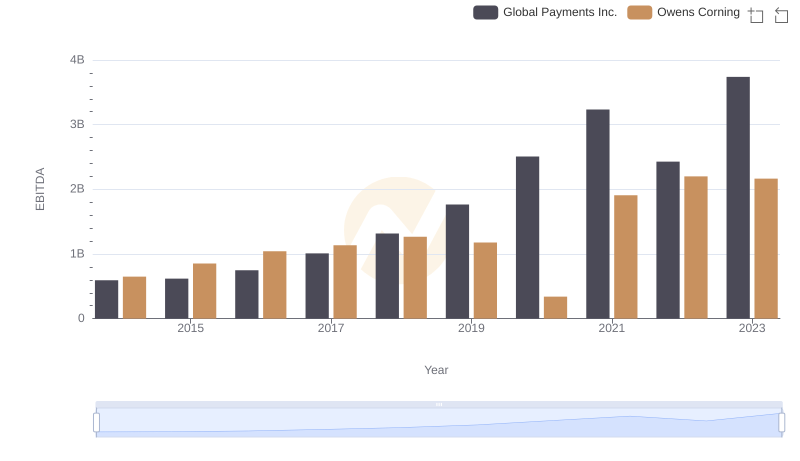
EBITDA Analysis: Evaluating Global Payments Inc. Against Owens Corning

Professional EBITDA Benchmarking: Global Payments Inc. vs Expeditors International of Washington, Inc.