| __timestamp | Expeditors International of Washington, Inc. | Global Payments Inc. |
|---|---|---|
| Wednesday, January 1, 2014 | 643940000 | 594102000 |
| Thursday, January 1, 2015 | 767496000 | 618109000 |
| Friday, January 1, 2016 | 716959000 | 748136000 |
| Sunday, January 1, 2017 | 749570000 | 1010019000 |
| Monday, January 1, 2018 | 850582000 | 1315968000 |
| Tuesday, January 1, 2019 | 817642000 | 1764994000 |
| Wednesday, January 1, 2020 | 1013523000 | 2508393000 |
| Friday, January 1, 2021 | 1975928000 | 3233589000 |
| Saturday, January 1, 2022 | 1916506000 | 2427684000 |
| Sunday, January 1, 2023 | 1087588000 | 3606789000 |
| Monday, January 1, 2024 | 1154330000 | 2333605000 |
Data in motion
In the ever-evolving landscape of global commerce, understanding the financial health of industry leaders is crucial. This analysis pits Global Payments Inc. against Expeditors International of Washington, Inc., two titans in their respective fields, over a decade-long journey from 2014 to 2023.
Global Payments Inc. has demonstrated a robust growth trajectory, with its EBITDA soaring by over 530% from 2014 to 2023. This impressive rise underscores its strategic expansions and adaptability in the financial services sector. In contrast, Expeditors International, a stalwart in logistics, saw a more modest yet steady increase of approximately 69% in the same period, reflecting its resilience amidst global supply chain challenges.
This comparative analysis not only highlights the dynamic nature of these industries but also offers valuable insights into the strategic maneuvers that have propelled these companies to the forefront of their sectors.
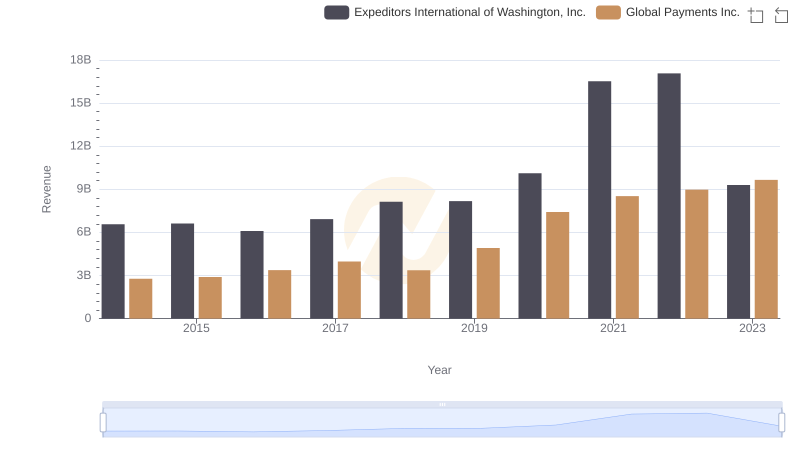
Global Payments Inc. or Expeditors International of Washington, Inc.: Who Leads in Yearly Revenue?
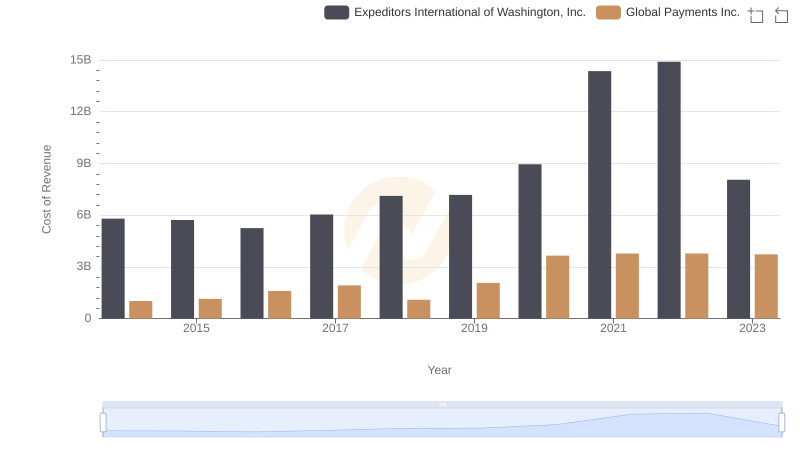
Analyzing Cost of Revenue: Global Payments Inc. and Expeditors International of Washington, Inc.
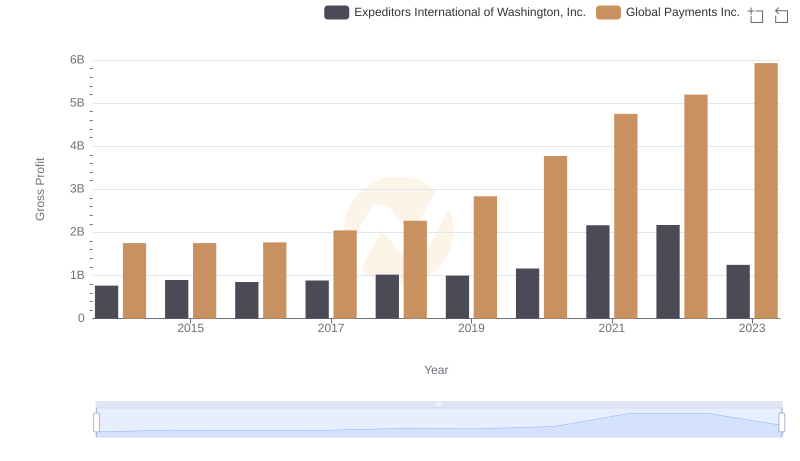
Gross Profit Trends Compared: Global Payments Inc. vs Expeditors International of Washington, Inc.
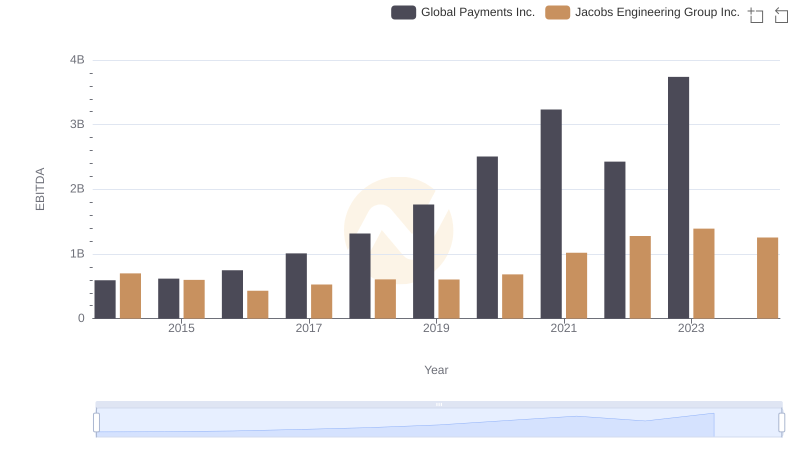
EBITDA Analysis: Evaluating Global Payments Inc. Against Jacobs Engineering Group Inc.
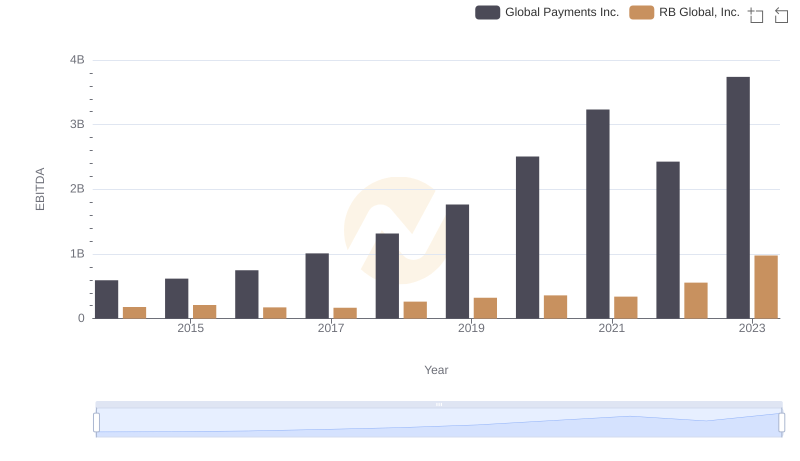
Comprehensive EBITDA Comparison: Global Payments Inc. vs RB Global, Inc.
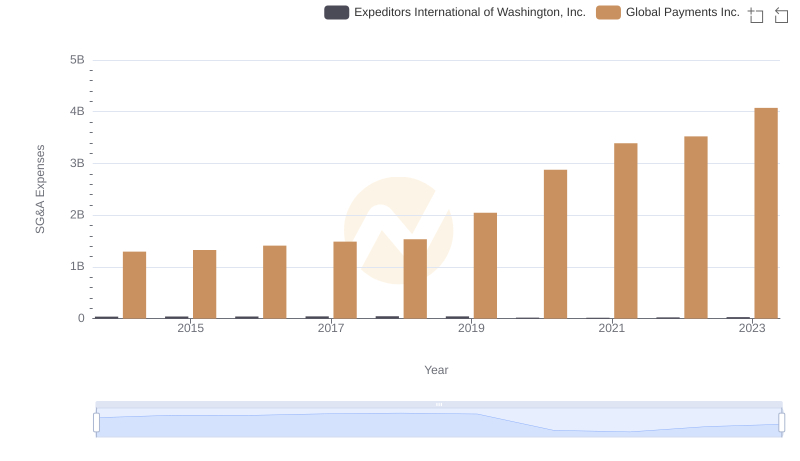
Breaking Down SG&A Expenses: Global Payments Inc. vs Expeditors International of Washington, Inc.
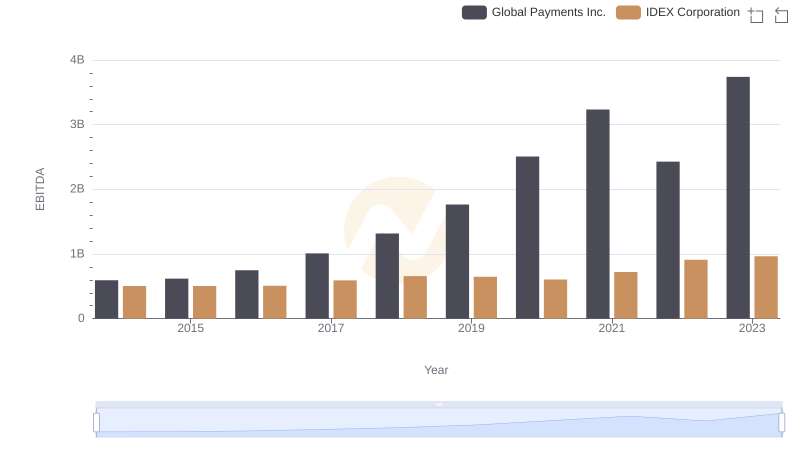
Global Payments Inc. vs IDEX Corporation: In-Depth EBITDA Performance Comparison
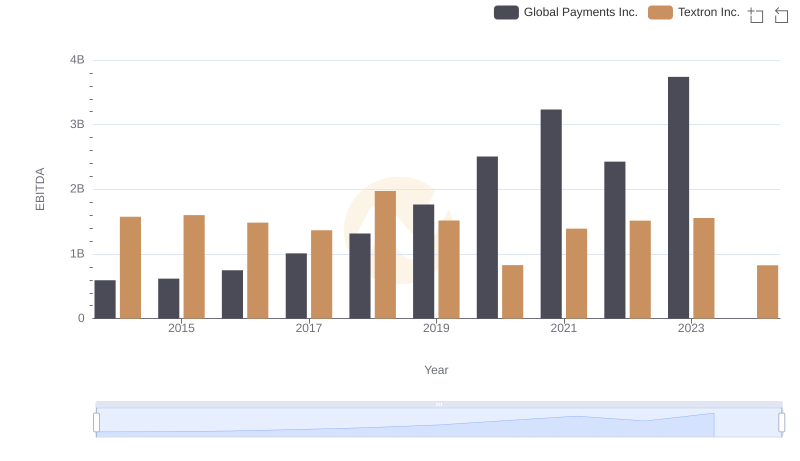
EBITDA Analysis: Evaluating Global Payments Inc. Against Textron Inc.
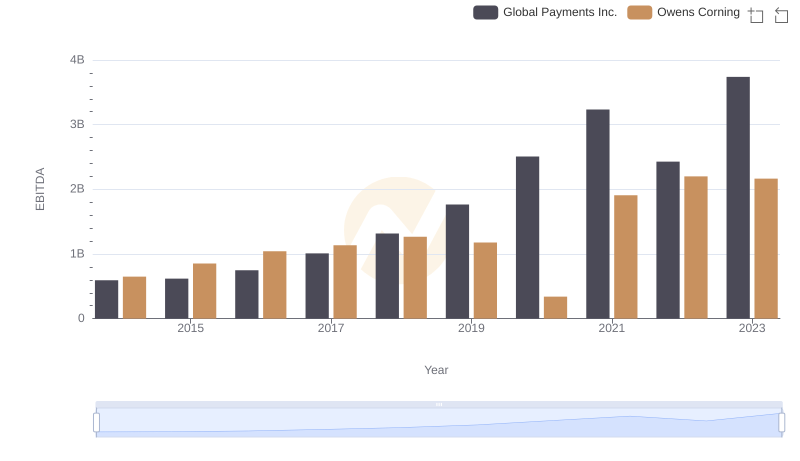
EBITDA Analysis: Evaluating Global Payments Inc. Against Owens Corning
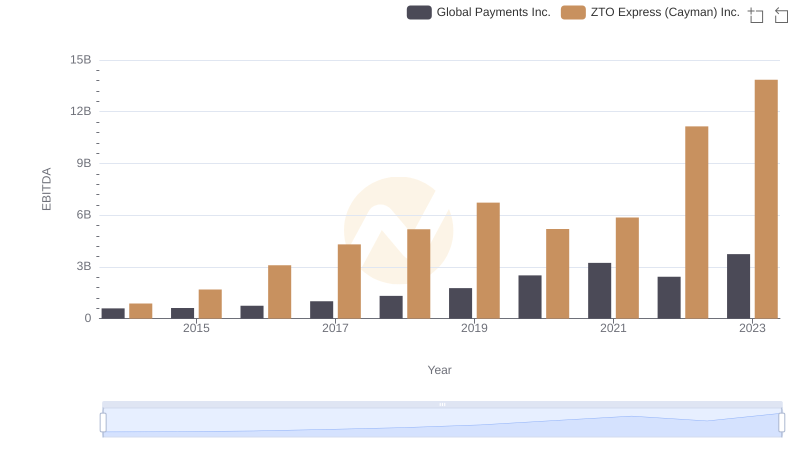
Global Payments Inc. and ZTO Express (Cayman) Inc.: A Detailed Examination of EBITDA Performance
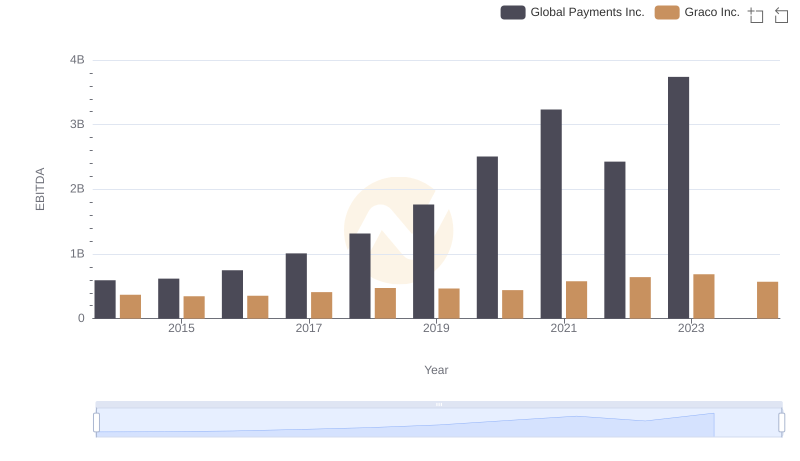
A Side-by-Side Analysis of EBITDA: Global Payments Inc. and Graco Inc.