| __timestamp | Global Payments Inc. | RB Global, Inc. |
|---|---|---|
| Wednesday, January 1, 2014 | 1751611000 | 423213000 |
| Thursday, January 1, 2015 | 1750511000 | 459849000 |
| Friday, January 1, 2016 | 1767444000 | 500333000 |
| Sunday, January 1, 2017 | 2047126000 | 531504000 |
| Monday, January 1, 2018 | 2271352000 | 636629000 |
| Tuesday, January 1, 2019 | 2838089000 | 672825000 |
| Wednesday, January 1, 2020 | 3772831000 | 761671000 |
| Friday, January 1, 2021 | 4750037000 | 822188000 |
| Saturday, January 1, 2022 | 5196898000 | 957107000 |
| Sunday, January 1, 2023 | 5926898000 | 1778400000 |
| Monday, January 1, 2024 | 6345778000 | 4284200000 |
Cracking the code
In the ever-evolving landscape of financial services, Global Payments Inc. and RB Global, Inc. have showcased remarkable growth over the past decade. From 2014 to 2023, Global Payments Inc. has seen its gross profit soar by approximately 238%, reflecting its strategic expansions and robust market presence. In contrast, RB Global, Inc. has experienced a significant 320% increase, highlighting its agility and adaptability in a competitive market.
These trends underscore the dynamic nature of the financial sector and the strategic prowess of these industry leaders.
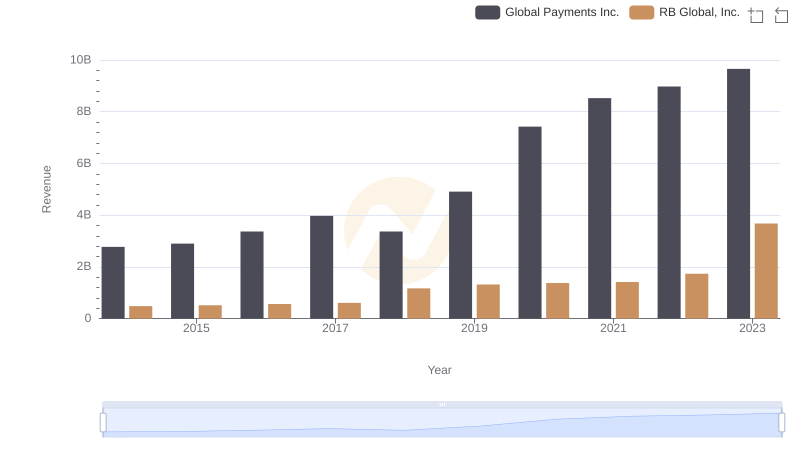
Comparing Revenue Performance: Global Payments Inc. or RB Global, Inc.?
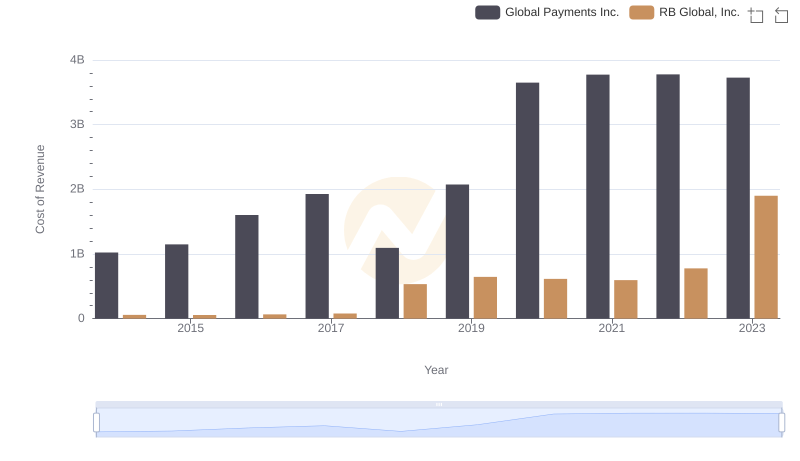
Cost of Revenue: Key Insights for Global Payments Inc. and RB Global, Inc.
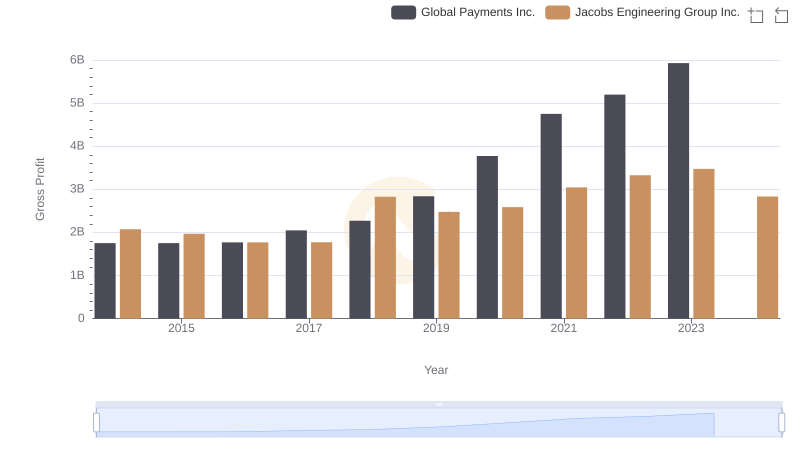
Global Payments Inc. vs Jacobs Engineering Group Inc.: A Gross Profit Performance Breakdown
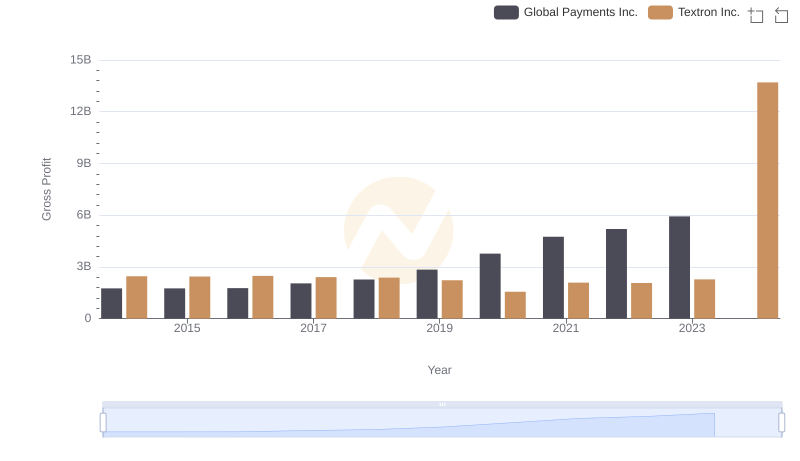
Key Insights on Gross Profit: Global Payments Inc. vs Textron Inc.
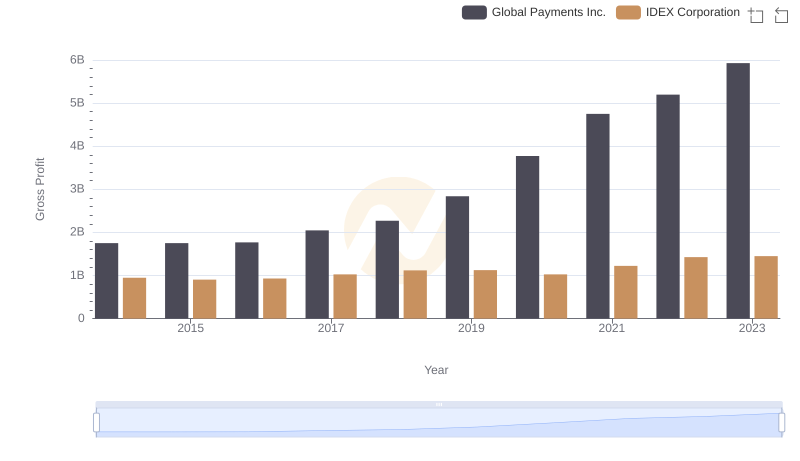
Gross Profit Comparison: Global Payments Inc. and IDEX Corporation Trends
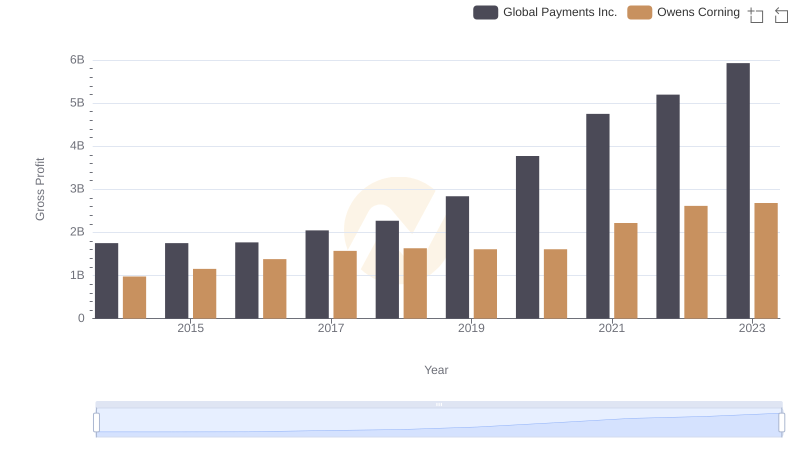
Global Payments Inc. and Owens Corning: A Detailed Gross Profit Analysis
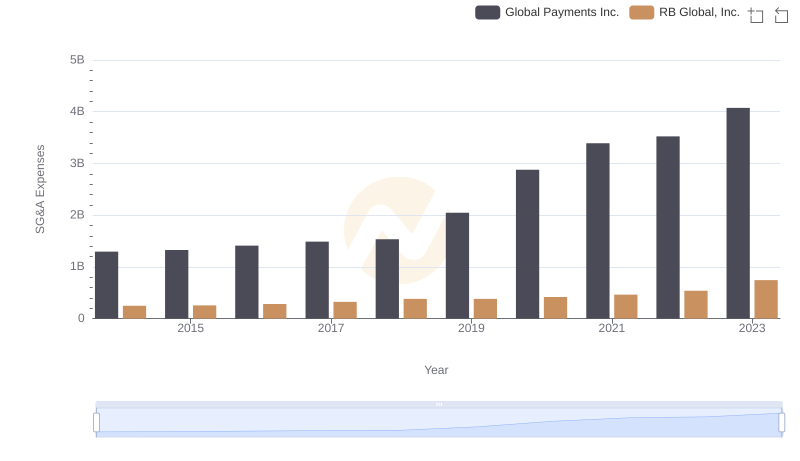
Cost Management Insights: SG&A Expenses for Global Payments Inc. and RB Global, Inc.
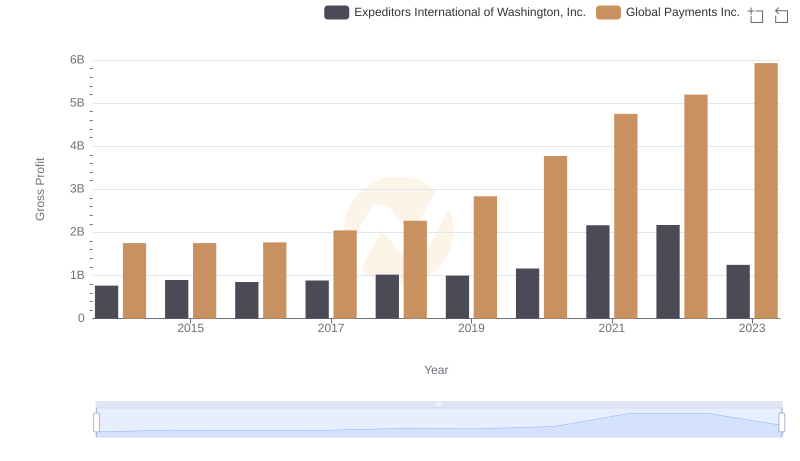
Gross Profit Trends Compared: Global Payments Inc. vs Expeditors International of Washington, Inc.
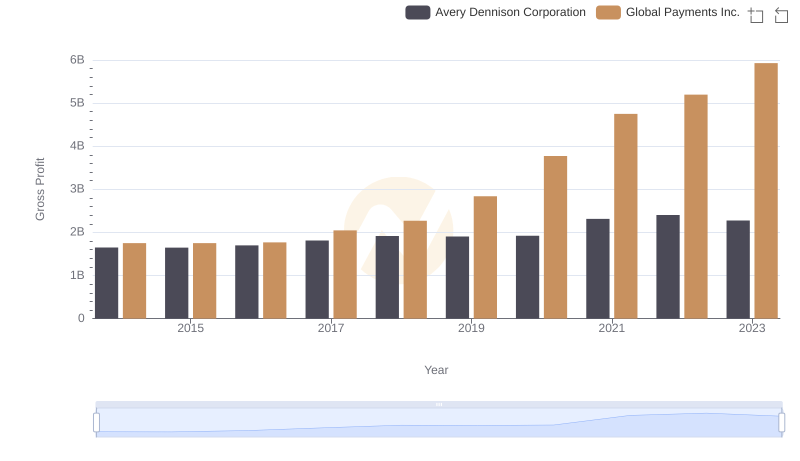
Global Payments Inc. vs Avery Dennison Corporation: A Gross Profit Performance Breakdown
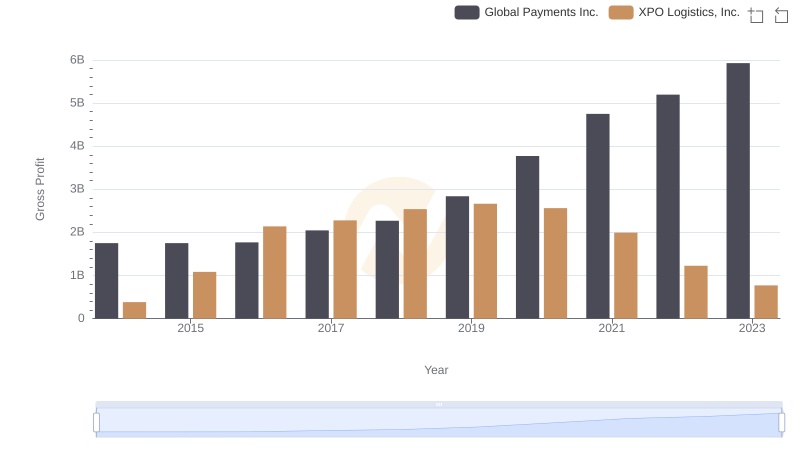
Gross Profit Analysis: Comparing Global Payments Inc. and XPO Logistics, Inc.
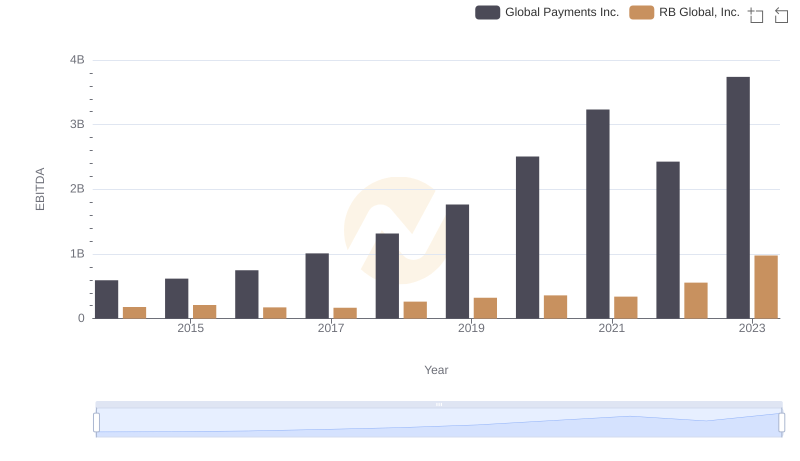
Comprehensive EBITDA Comparison: Global Payments Inc. vs RB Global, Inc.