| __timestamp | Global Payments Inc. | Textron Inc. |
|---|---|---|
| Wednesday, January 1, 2014 | 594102000 | 1575000000 |
| Thursday, January 1, 2015 | 618109000 | 1601000000 |
| Friday, January 1, 2016 | 748136000 | 1484000000 |
| Sunday, January 1, 2017 | 1010019000 | 1367000000 |
| Monday, January 1, 2018 | 1315968000 | 1974000000 |
| Tuesday, January 1, 2019 | 1764994000 | 1518000000 |
| Wednesday, January 1, 2020 | 2508393000 | 827000000 |
| Friday, January 1, 2021 | 3233589000 | 1391000000 |
| Saturday, January 1, 2022 | 2427684000 | 1515000000 |
| Sunday, January 1, 2023 | 3606789000 | 1556000000 |
| Monday, January 1, 2024 | 2333605000 | 1422000000 |
Unlocking the unknown
In the ever-evolving landscape of financial performance, EBITDA serves as a crucial metric for evaluating a company's operational efficiency. Over the past decade, Global Payments Inc. has demonstrated a remarkable growth trajectory, with its EBITDA surging by over 500% from 2014 to 2023. This growth underscores the company's strategic initiatives and market adaptability. In contrast, Textron Inc. has maintained a more stable EBITDA, with fluctuations reflecting industry challenges and economic cycles.
The data highlights the dynamic nature of these industries, with Global Payments Inc. capitalizing on digital transformation, while Textron Inc. navigates the complexities of manufacturing and innovation.
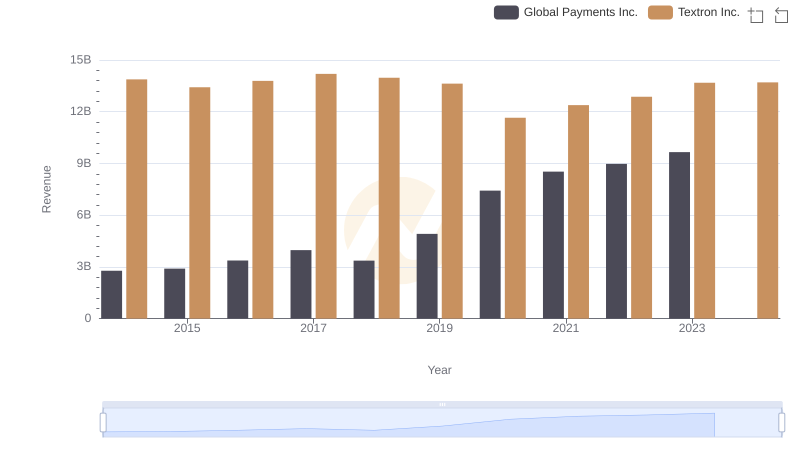
Global Payments Inc. and Textron Inc.: A Comprehensive Revenue Analysis
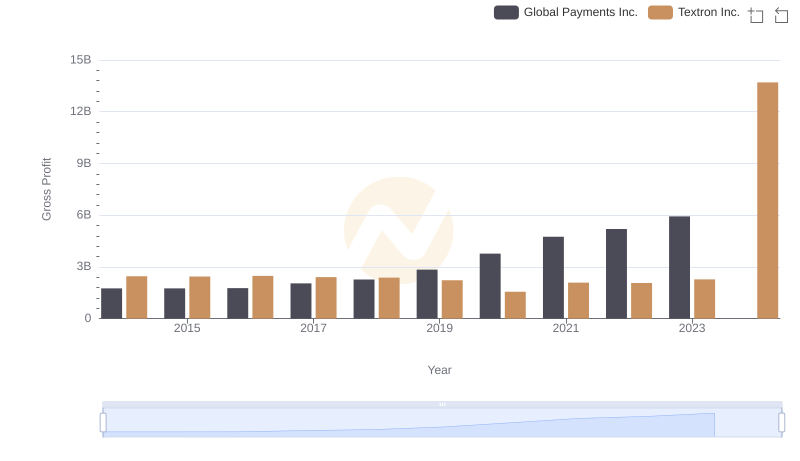
Key Insights on Gross Profit: Global Payments Inc. vs Textron Inc.
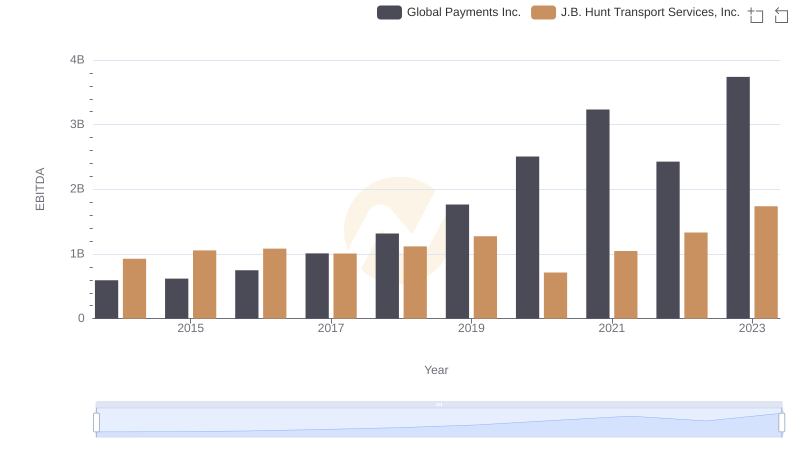
Comprehensive EBITDA Comparison: Global Payments Inc. vs J.B. Hunt Transport Services, Inc.
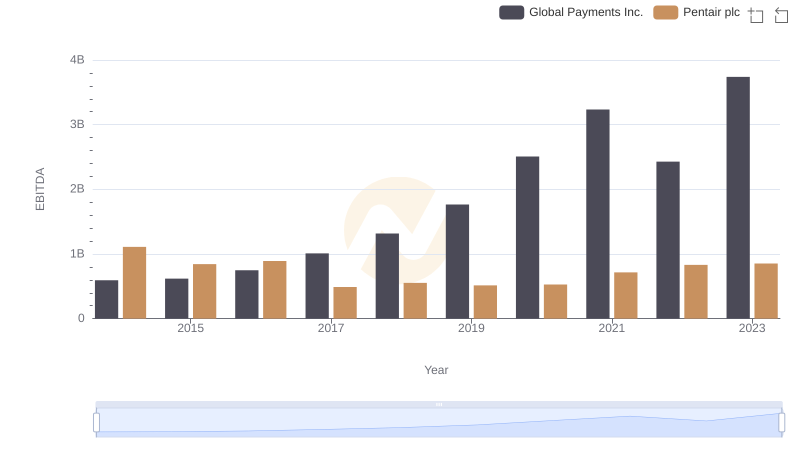
Professional EBITDA Benchmarking: Global Payments Inc. vs Pentair plc
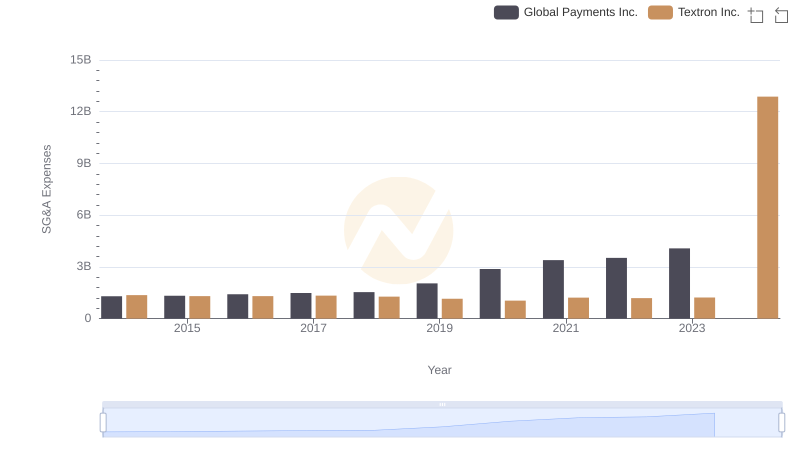
Cost Management Insights: SG&A Expenses for Global Payments Inc. and Textron Inc.
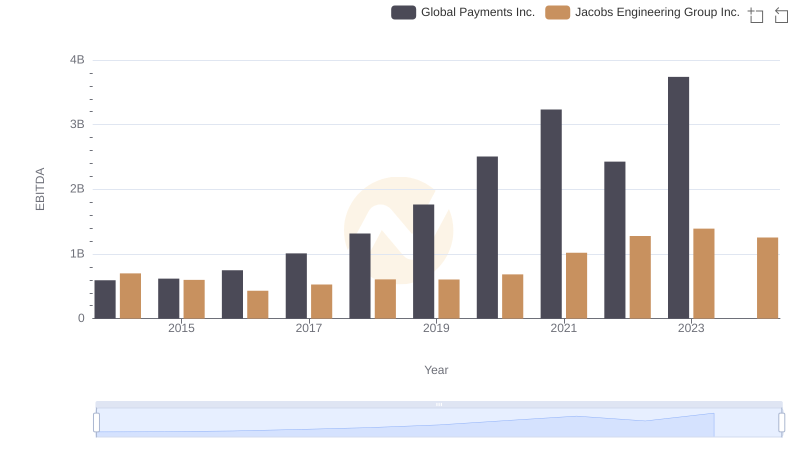
EBITDA Analysis: Evaluating Global Payments Inc. Against Jacobs Engineering Group Inc.
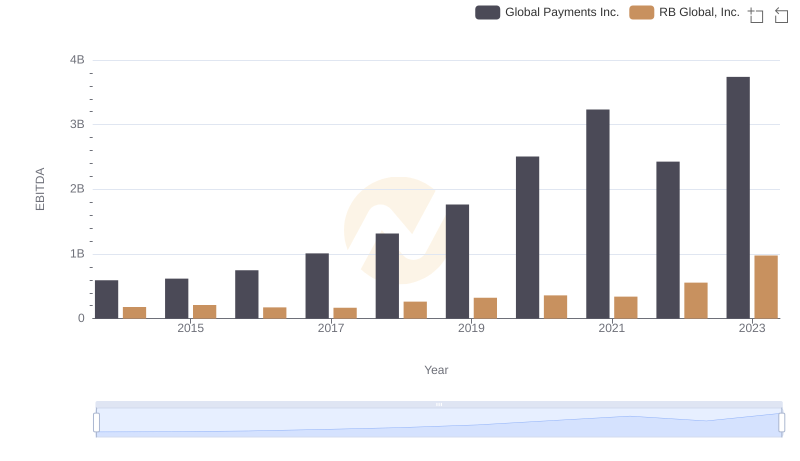
Comprehensive EBITDA Comparison: Global Payments Inc. vs RB Global, Inc.
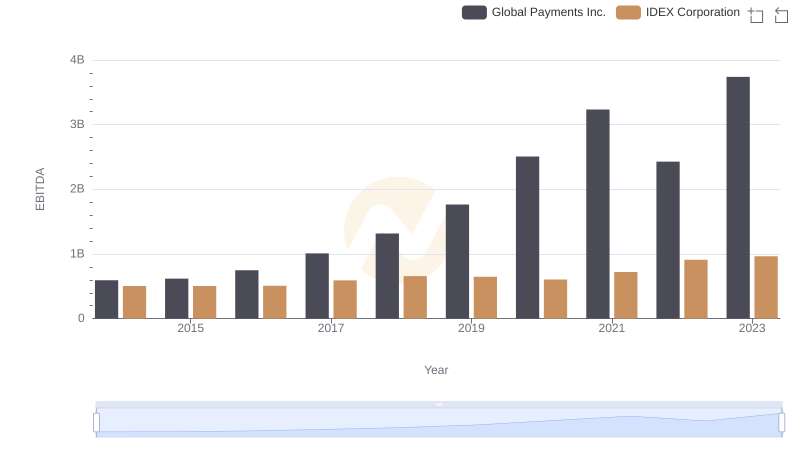
Global Payments Inc. vs IDEX Corporation: In-Depth EBITDA Performance Comparison
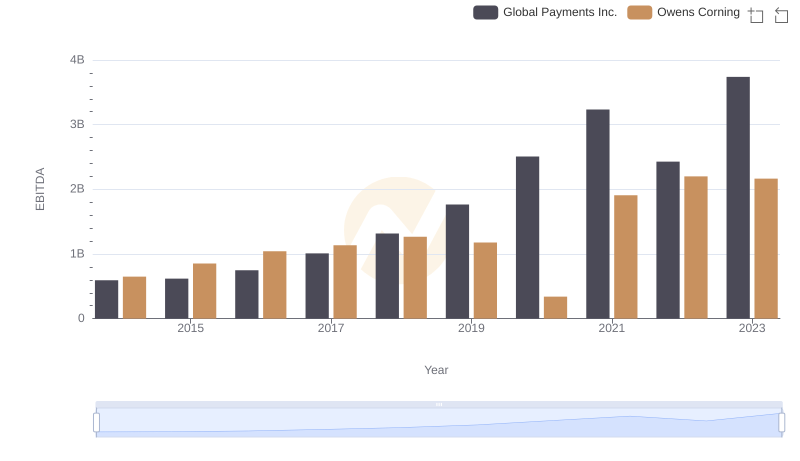
EBITDA Analysis: Evaluating Global Payments Inc. Against Owens Corning

Professional EBITDA Benchmarking: Global Payments Inc. vs Expeditors International of Washington, Inc.
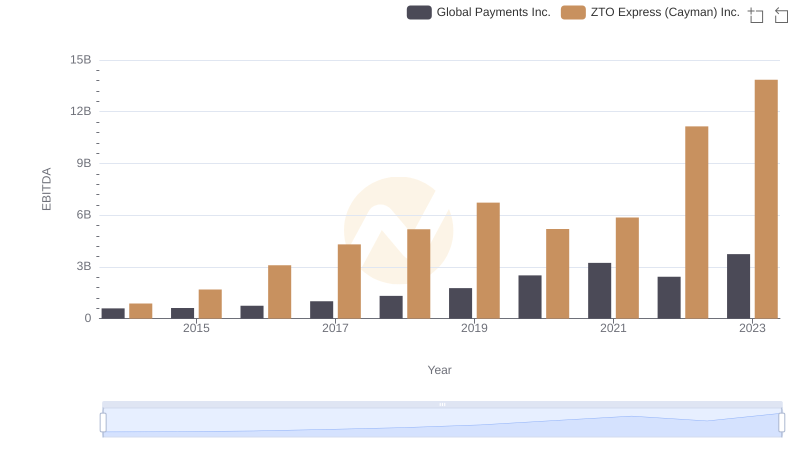
Global Payments Inc. and ZTO Express (Cayman) Inc.: A Detailed Examination of EBITDA Performance