| __timestamp | Global Payments Inc. | IDEX Corporation |
|---|---|---|
| Wednesday, January 1, 2014 | 594102000 | 504019000 |
| Thursday, January 1, 2015 | 618109000 | 505071000 |
| Friday, January 1, 2016 | 748136000 | 507871000 |
| Sunday, January 1, 2017 | 1010019000 | 591033000 |
| Monday, January 1, 2018 | 1315968000 | 657092000 |
| Tuesday, January 1, 2019 | 1764994000 | 647793000 |
| Wednesday, January 1, 2020 | 2508393000 | 604602000 |
| Friday, January 1, 2021 | 3233589000 | 720500000 |
| Saturday, January 1, 2022 | 2427684000 | 909800000 |
| Sunday, January 1, 2023 | 3606789000 | 964100000 |
| Monday, January 1, 2024 | 2333605000 | 677200000 |
Unleashing insights
In the ever-evolving landscape of financial performance, Global Payments Inc. and IDEX Corporation have showcased intriguing trajectories over the past decade. From 2014 to 2023, Global Payments Inc. has seen its EBITDA grow by an impressive 530%, peaking in 2023. This growth reflects the company's strategic expansions and robust market positioning. In contrast, IDEX Corporation, while more modest in its growth, has demonstrated a steady 91% increase in EBITDA over the same period, highlighting its consistent operational efficiency.
This comparison underscores the dynamic nature of financial strategies and market adaptability, offering valuable insights for investors and industry analysts alike.
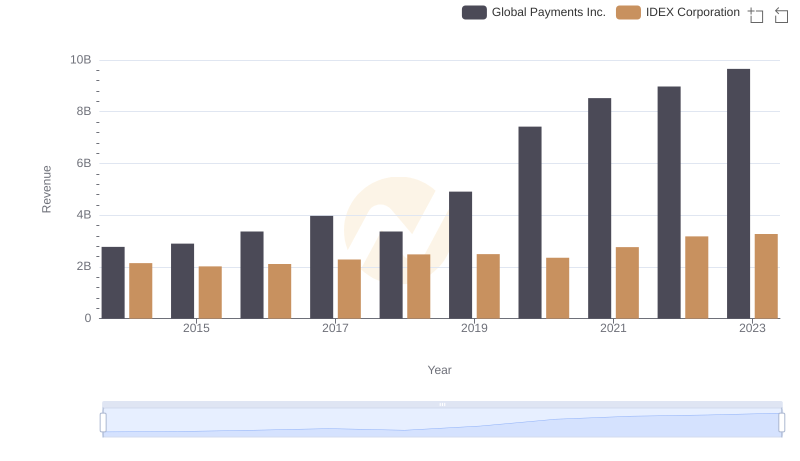
Comparing Revenue Performance: Global Payments Inc. or IDEX Corporation?
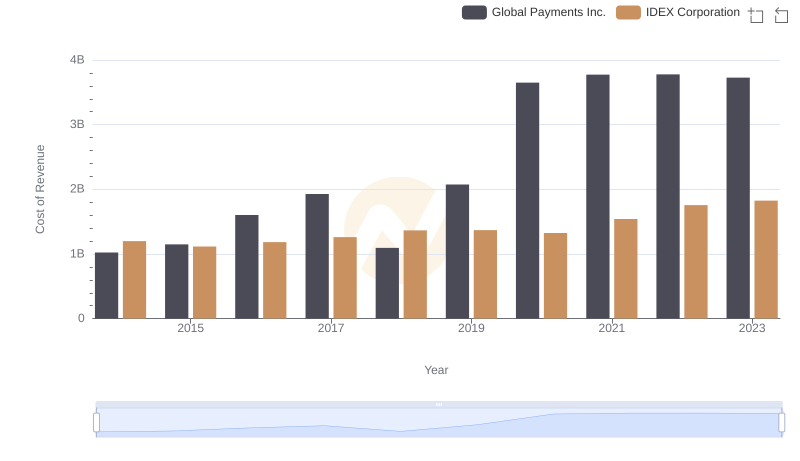
Comparing Cost of Revenue Efficiency: Global Payments Inc. vs IDEX Corporation
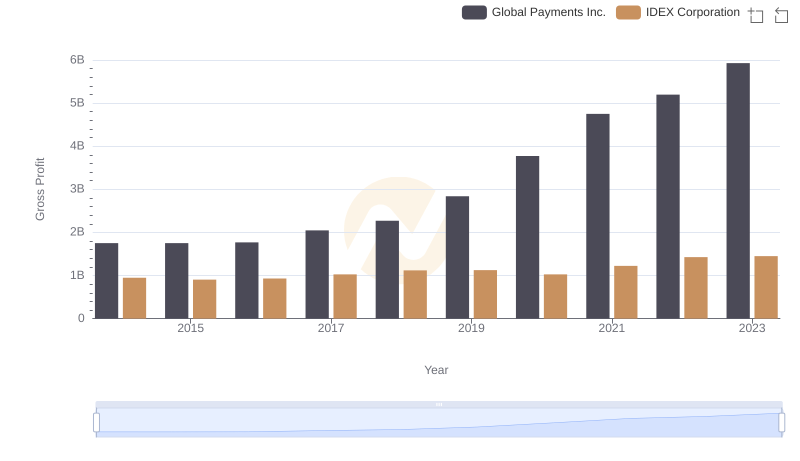
Gross Profit Comparison: Global Payments Inc. and IDEX Corporation Trends
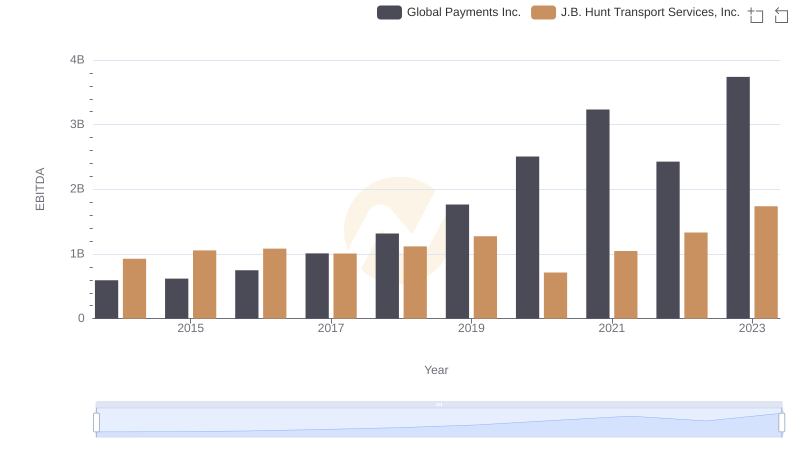
Comprehensive EBITDA Comparison: Global Payments Inc. vs J.B. Hunt Transport Services, Inc.
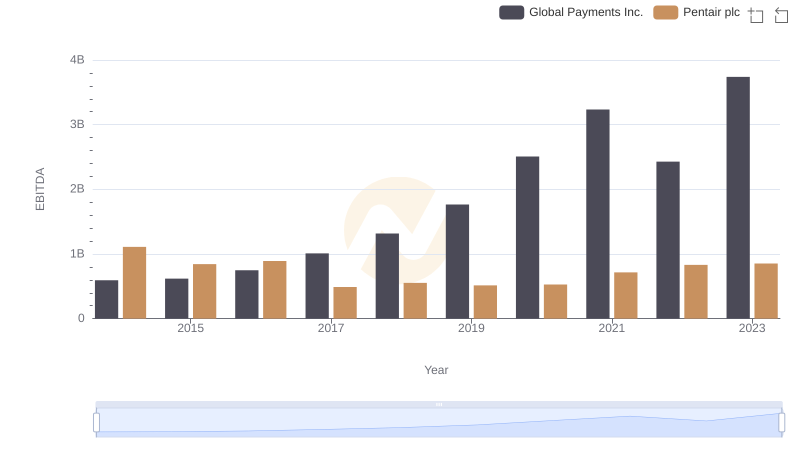
Professional EBITDA Benchmarking: Global Payments Inc. vs Pentair plc
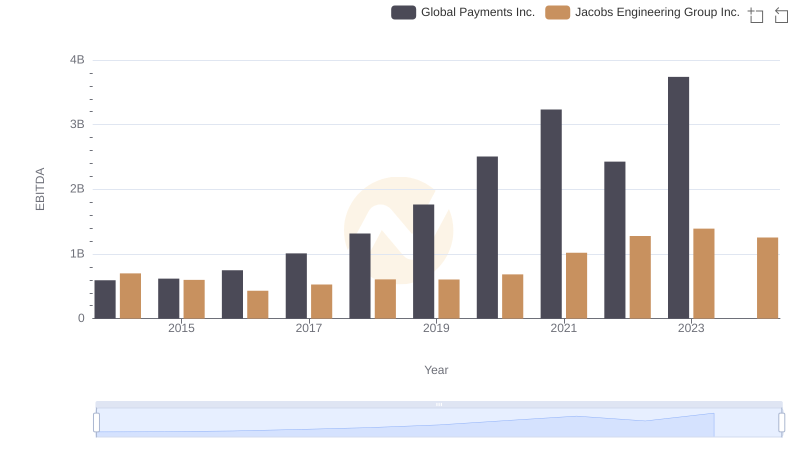
EBITDA Analysis: Evaluating Global Payments Inc. Against Jacobs Engineering Group Inc.
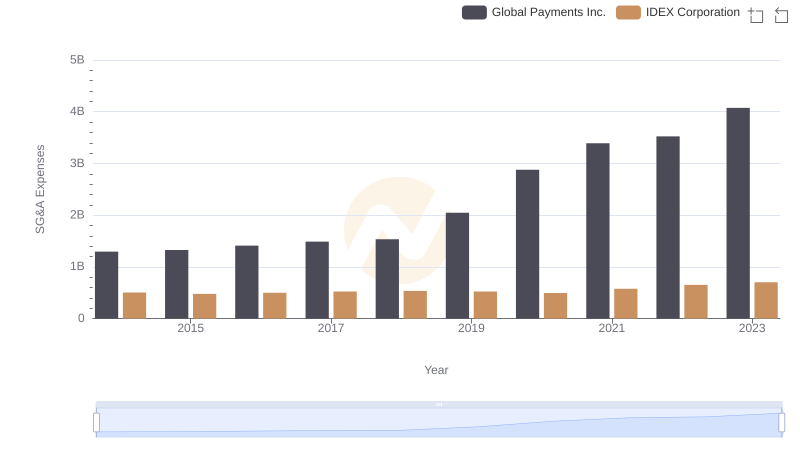
Who Optimizes SG&A Costs Better? Global Payments Inc. or IDEX Corporation
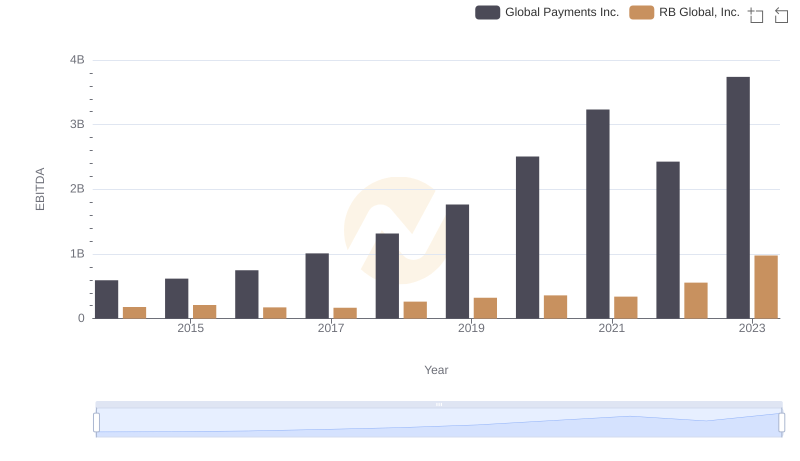
Comprehensive EBITDA Comparison: Global Payments Inc. vs RB Global, Inc.
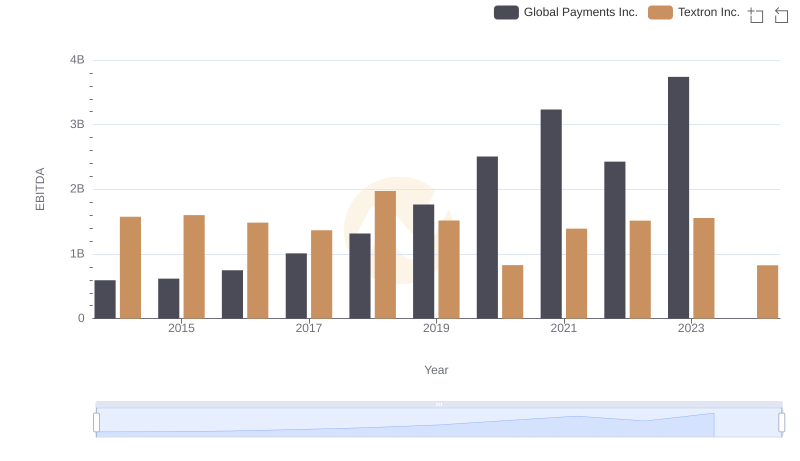
EBITDA Analysis: Evaluating Global Payments Inc. Against Textron Inc.
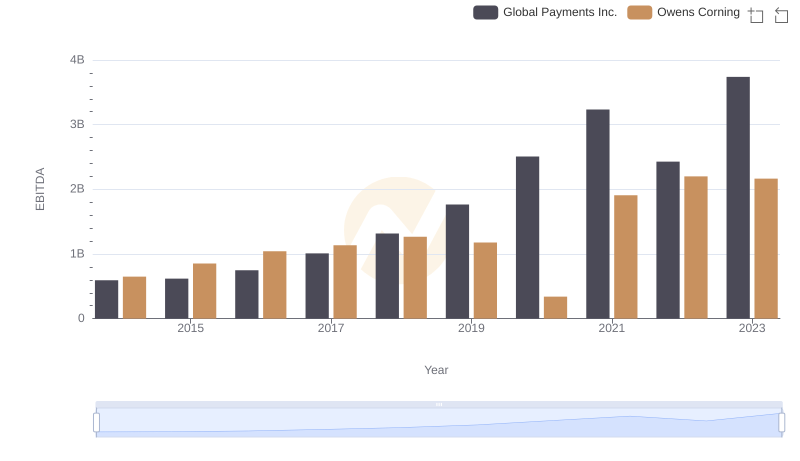
EBITDA Analysis: Evaluating Global Payments Inc. Against Owens Corning

Professional EBITDA Benchmarking: Global Payments Inc. vs Expeditors International of Washington, Inc.