| __timestamp | Global Payments Inc. | RB Global, Inc. |
|---|---|---|
| Wednesday, January 1, 2014 | 1022107000 | 57884000 |
| Thursday, January 1, 2015 | 1147639000 | 56026000 |
| Friday, January 1, 2016 | 1603532000 | 66062000 |
| Sunday, January 1, 2017 | 1928037000 | 79013000 |
| Monday, January 1, 2018 | 1095014000 | 533397000 |
| Tuesday, January 1, 2019 | 2073803000 | 645816000 |
| Wednesday, January 1, 2020 | 3650727000 | 615589000 |
| Friday, January 1, 2021 | 3773725000 | 594783000 |
| Saturday, January 1, 2022 | 3778617000 | 776701000 |
| Sunday, January 1, 2023 | 3727521000 | 1901200000 |
| Monday, January 1, 2024 | 3760116000 | 0 |
Unveiling the hidden dimensions of data
In the ever-evolving landscape of financial services, understanding cost structures is crucial. Global Payments Inc. and RB Global, Inc. have shown distinct trajectories in their cost of revenue from 2014 to 2023. Global Payments Inc. has seen a remarkable increase, with costs rising by approximately 265% over the decade, peaking in 2022. This growth reflects their expanding operations and market reach. In contrast, RB Global, Inc. experienced a more modest increase of around 3,200% over the same period, with a significant spike in 2023, indicating strategic shifts or market adaptations. These trends highlight the dynamic nature of cost management in the financial sector, emphasizing the importance of strategic planning and operational efficiency. As these companies navigate the complexities of global markets, their cost of revenue serves as a key indicator of their financial health and strategic direction.
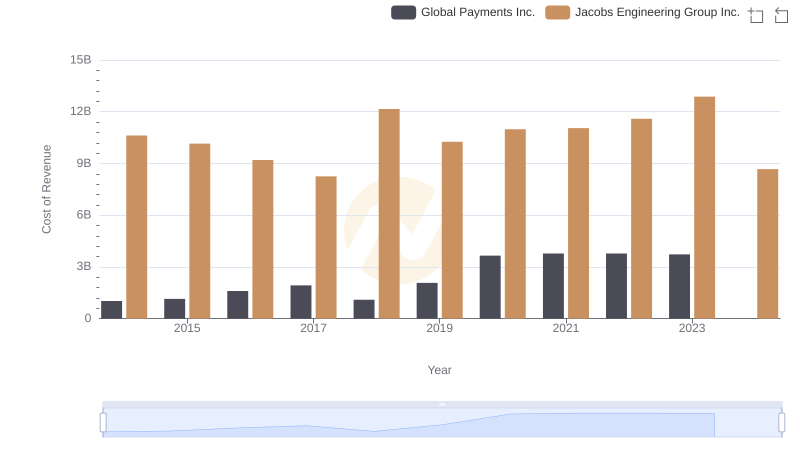
Cost Insights: Breaking Down Global Payments Inc. and Jacobs Engineering Group Inc.'s Expenses
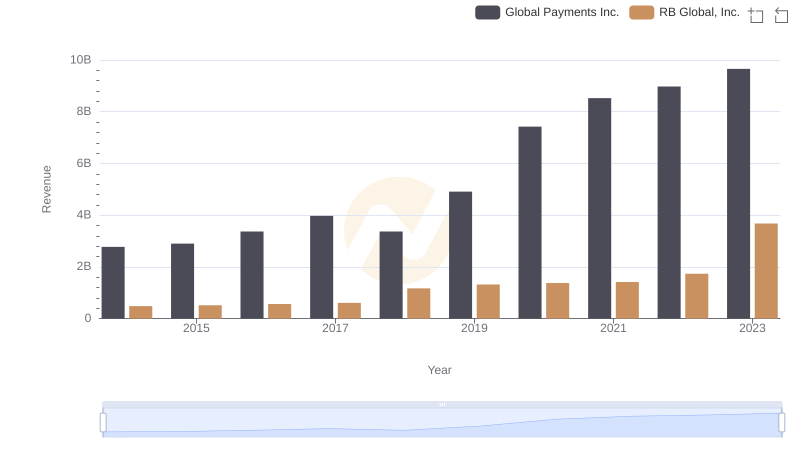
Comparing Revenue Performance: Global Payments Inc. or RB Global, Inc.?
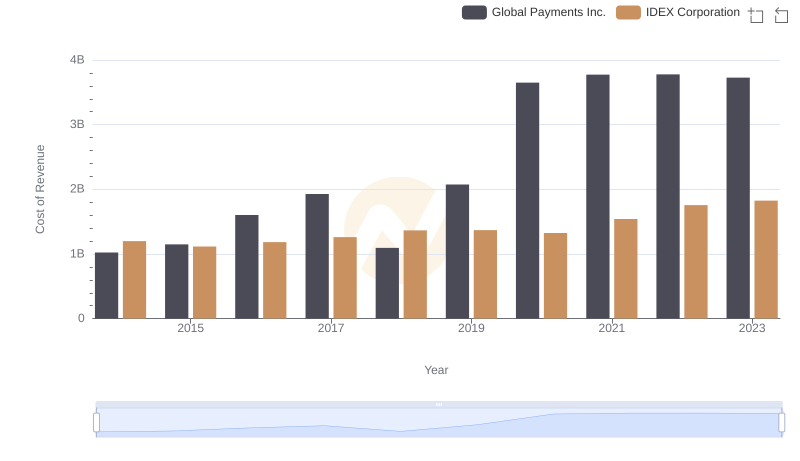
Comparing Cost of Revenue Efficiency: Global Payments Inc. vs IDEX Corporation
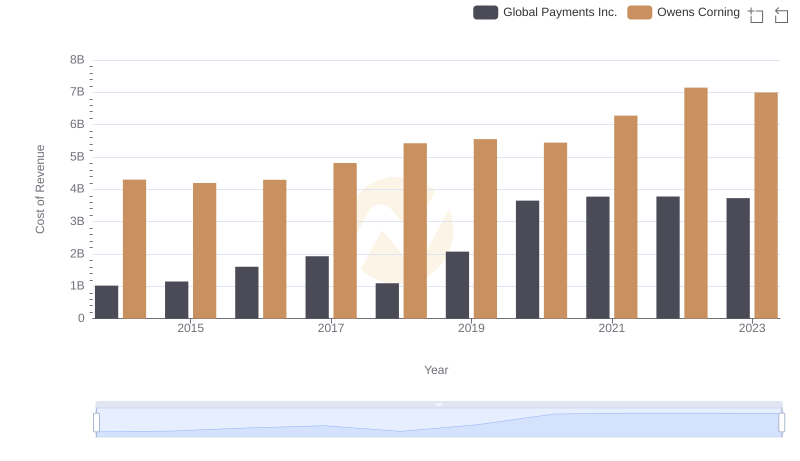
Cost of Revenue Trends: Global Payments Inc. vs Owens Corning
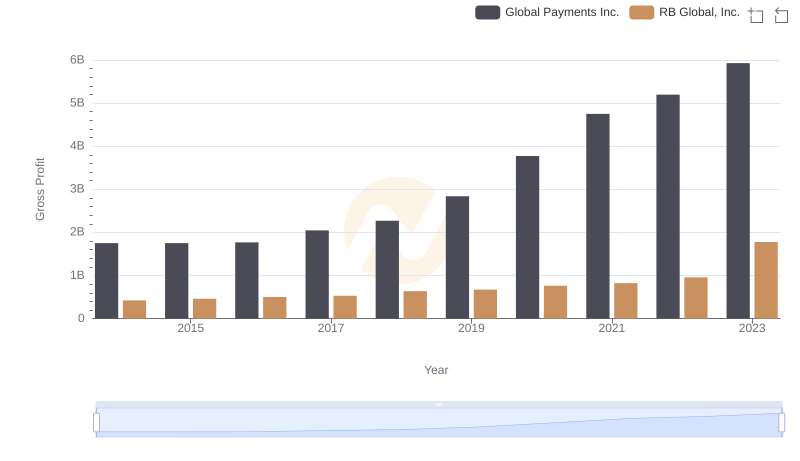
Gross Profit Comparison: Global Payments Inc. and RB Global, Inc. Trends
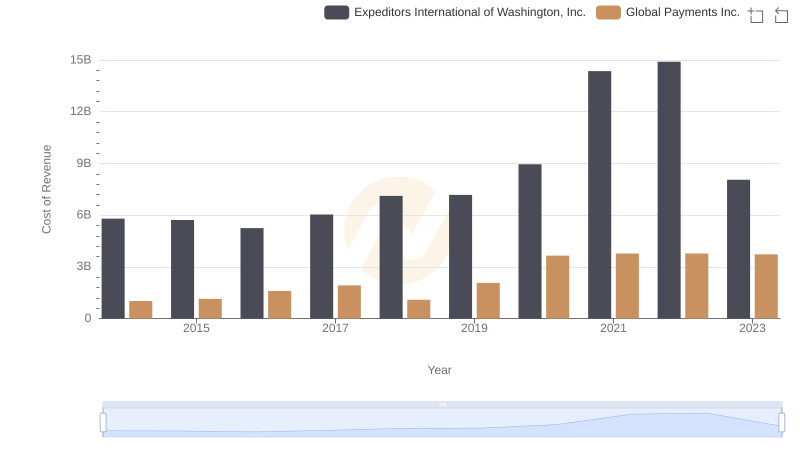
Analyzing Cost of Revenue: Global Payments Inc. and Expeditors International of Washington, Inc.
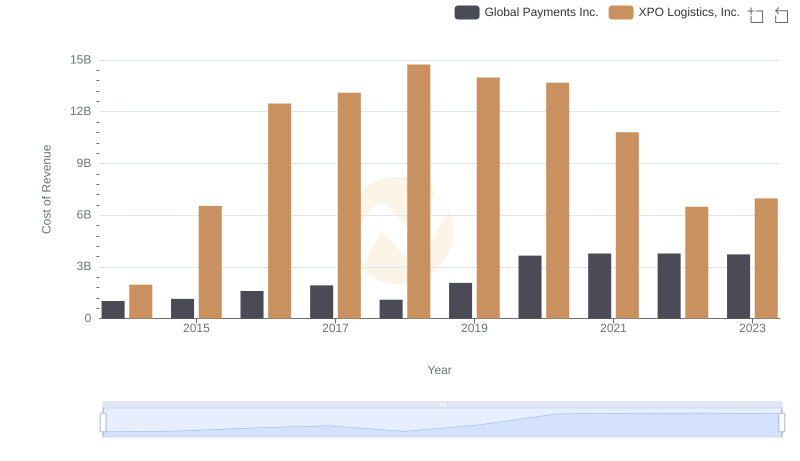
Cost of Revenue Comparison: Global Payments Inc. vs XPO Logistics, Inc.
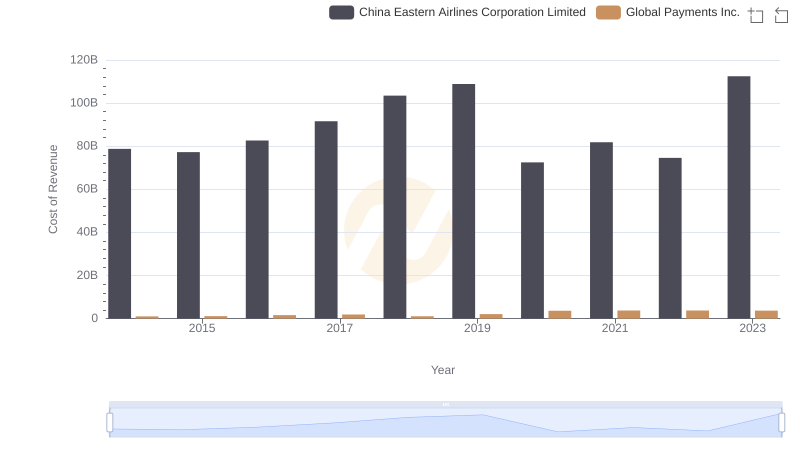
Cost of Revenue Trends: Global Payments Inc. vs China Eastern Airlines Corporation Limited
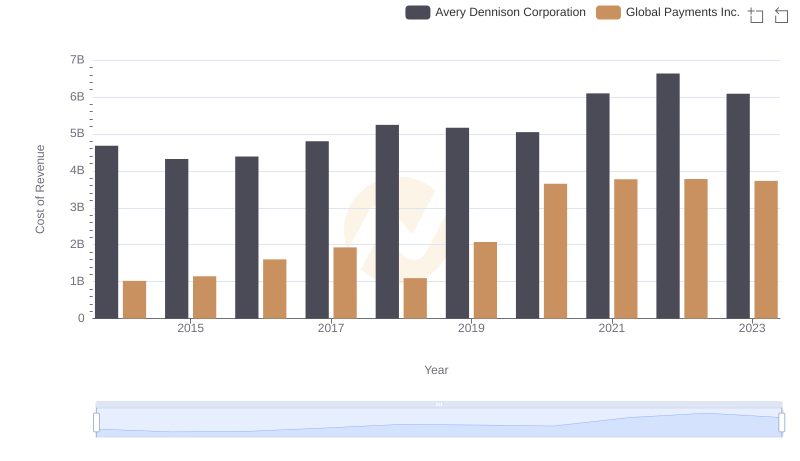
Cost of Revenue Comparison: Global Payments Inc. vs Avery Dennison Corporation
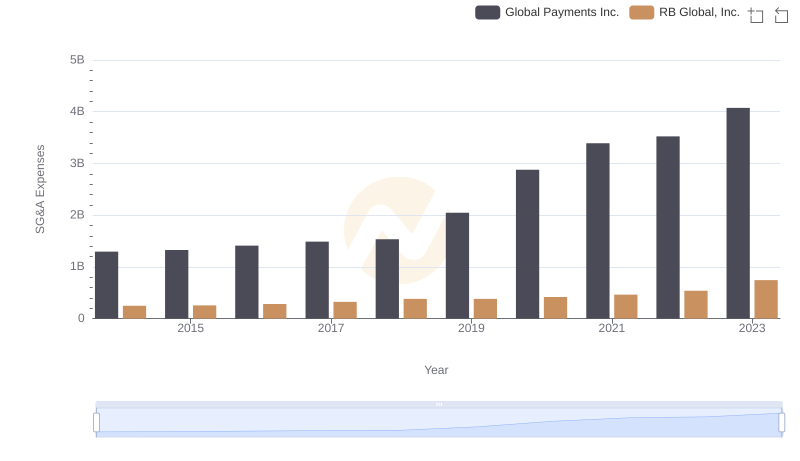
Cost Management Insights: SG&A Expenses for Global Payments Inc. and RB Global, Inc.
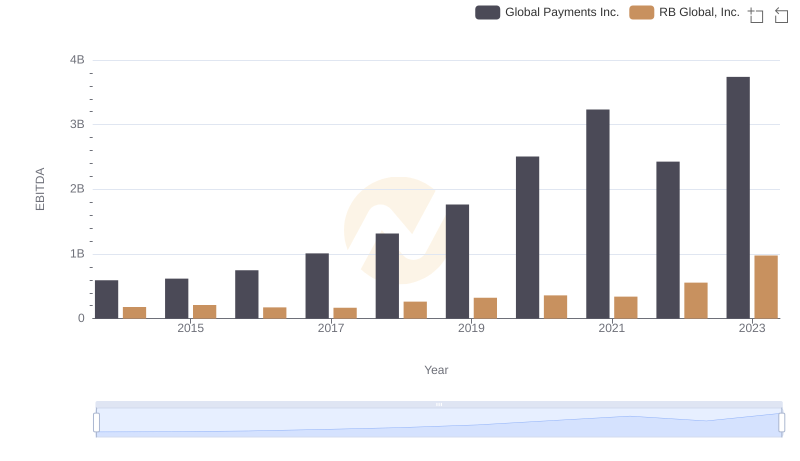
Comprehensive EBITDA Comparison: Global Payments Inc. vs RB Global, Inc.