| __timestamp | Pool Corporation | United Rentals, Inc. |
|---|---|---|
| Wednesday, January 1, 2014 | 1603222000 | 3253000000 |
| Thursday, January 1, 2015 | 1687495000 | 3337000000 |
| Friday, January 1, 2016 | 1829716000 | 3359000000 |
| Sunday, January 1, 2017 | 1982899000 | 3872000000 |
| Monday, January 1, 2018 | 2127924000 | 4683000000 |
| Tuesday, January 1, 2019 | 2274592000 | 5681000000 |
| Wednesday, January 1, 2020 | 2805721000 | 5347000000 |
| Friday, January 1, 2021 | 3678492000 | 5863000000 |
| Saturday, January 1, 2022 | 4246315000 | 6646000000 |
| Sunday, January 1, 2023 | 3881551000 | 8519000000 |
| Monday, January 1, 2024 | 9195000000 |
Unleashing the power of data
In the competitive landscape of equipment rental and pool supply industries, cost efficiency is a critical metric. From 2014 to 2023, United Rentals, Inc. and Pool Corporation have shown distinct trends in their cost of revenue. United Rentals, Inc. has consistently maintained a higher cost of revenue, peaking at approximately $8.5 billion in 2023, reflecting a 162% increase from 2014. In contrast, Pool Corporation's cost of revenue grew by 142% over the same period, reaching around $3.9 billion in 2023. This divergence highlights United Rentals' aggressive expansion strategy, while Pool Corporation's steadier growth suggests a focus on optimizing operational efficiency. Notably, the data for 2024 is incomplete, indicating potential shifts in these trends. As these companies navigate economic fluctuations, their cost management strategies will be pivotal in maintaining competitive advantage.
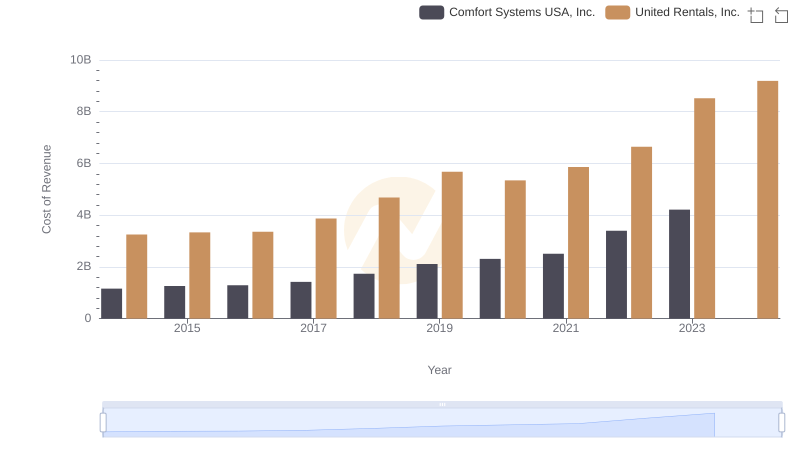
Cost of Revenue Trends: United Rentals, Inc. vs Comfort Systems USA, Inc.
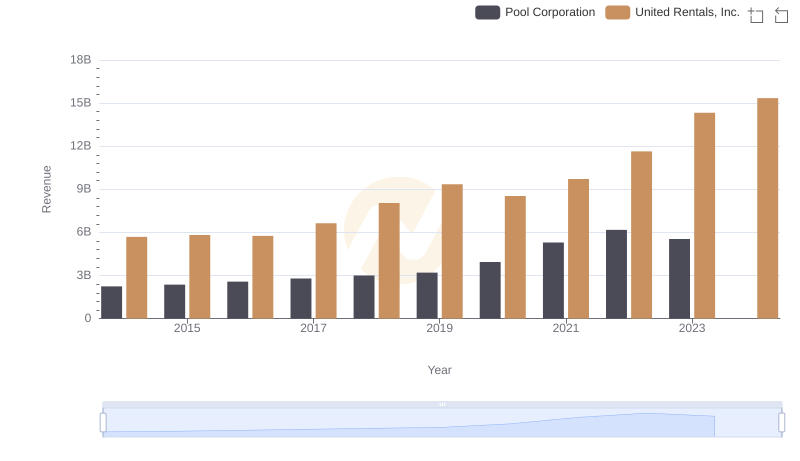
Annual Revenue Comparison: United Rentals, Inc. vs Pool Corporation
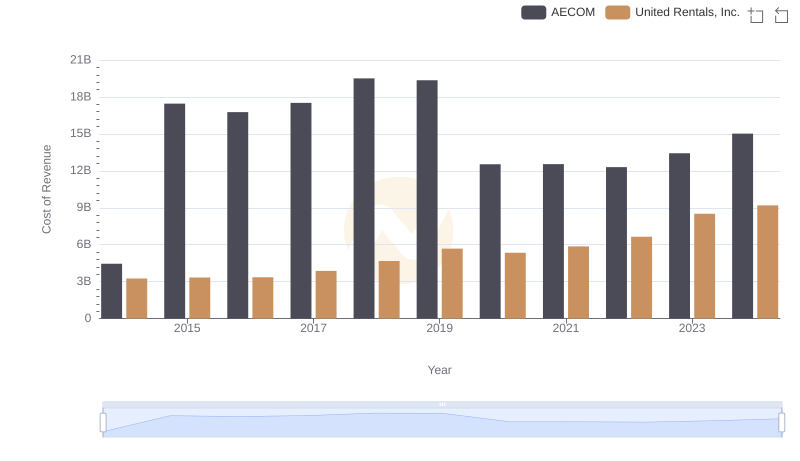
Cost of Revenue Comparison: United Rentals, Inc. vs AECOM
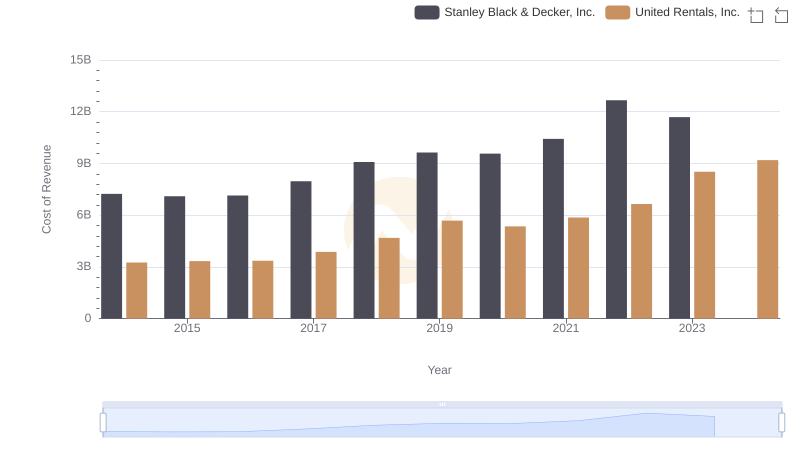
Comparing Cost of Revenue Efficiency: United Rentals, Inc. vs Stanley Black & Decker, Inc.
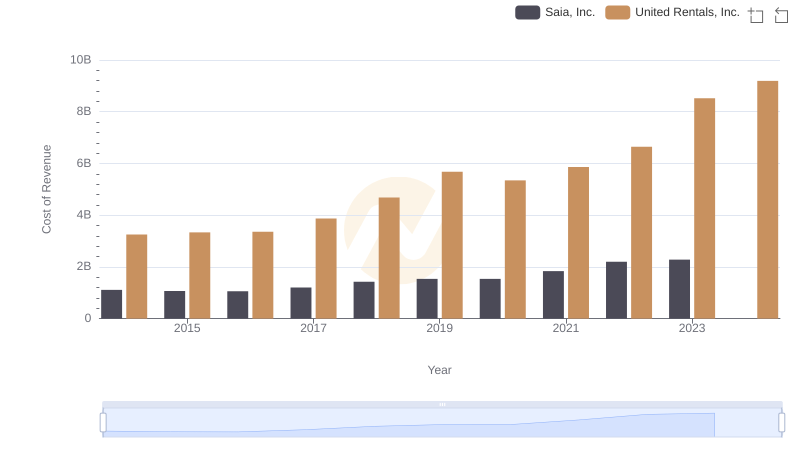
Cost of Revenue Comparison: United Rentals, Inc. vs Saia, Inc.
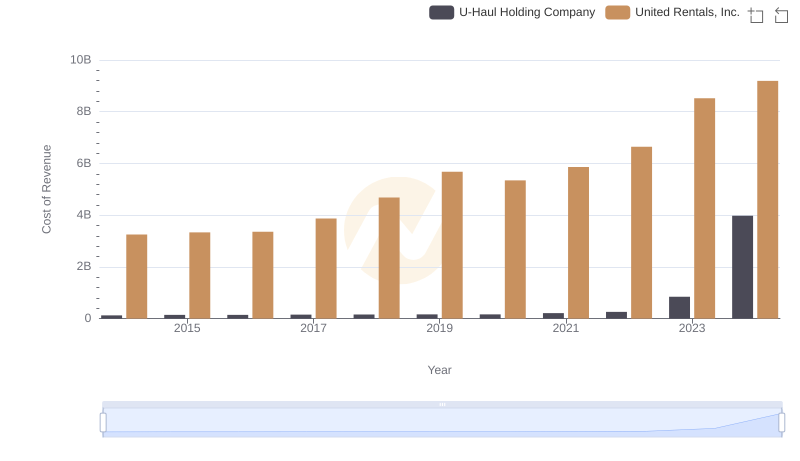
Cost of Revenue Comparison: United Rentals, Inc. vs U-Haul Holding Company
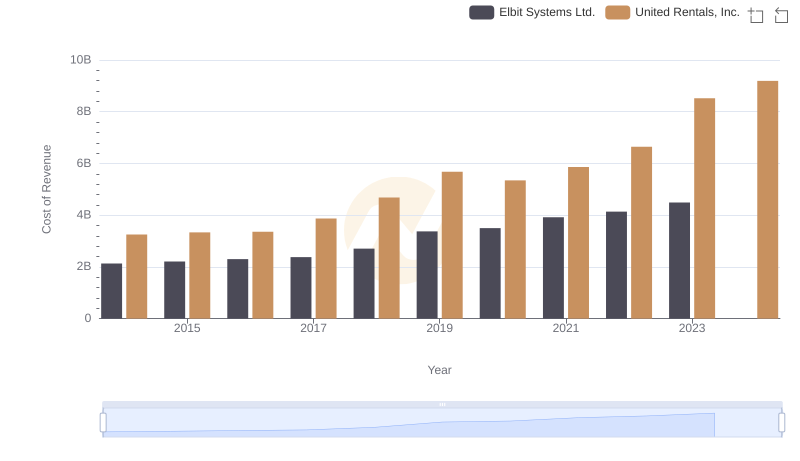
Comparing Cost of Revenue Efficiency: United Rentals, Inc. vs Elbit Systems Ltd.
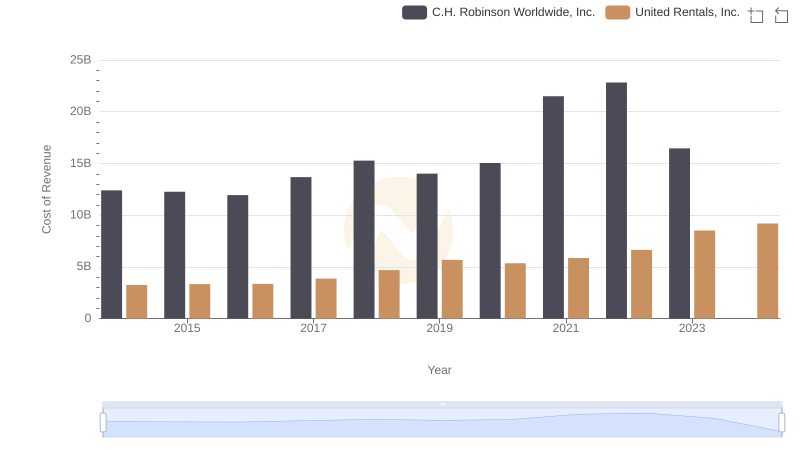
United Rentals, Inc. vs C.H. Robinson Worldwide, Inc.: Efficiency in Cost of Revenue Explored
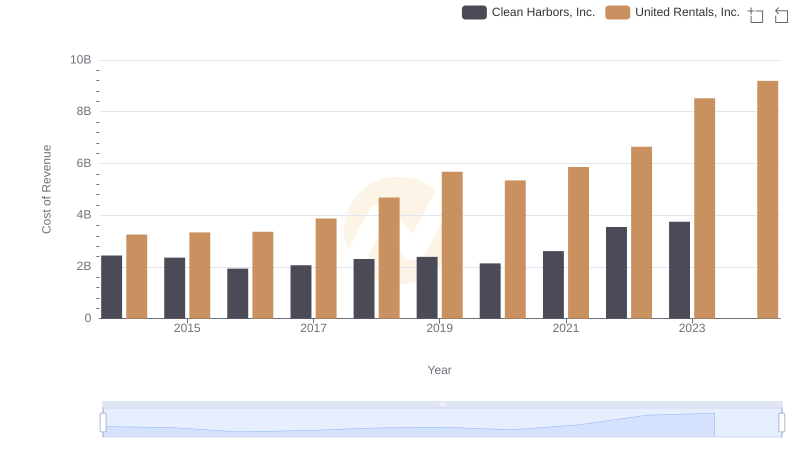
Cost of Revenue: Key Insights for United Rentals, Inc. and Clean Harbors, Inc.
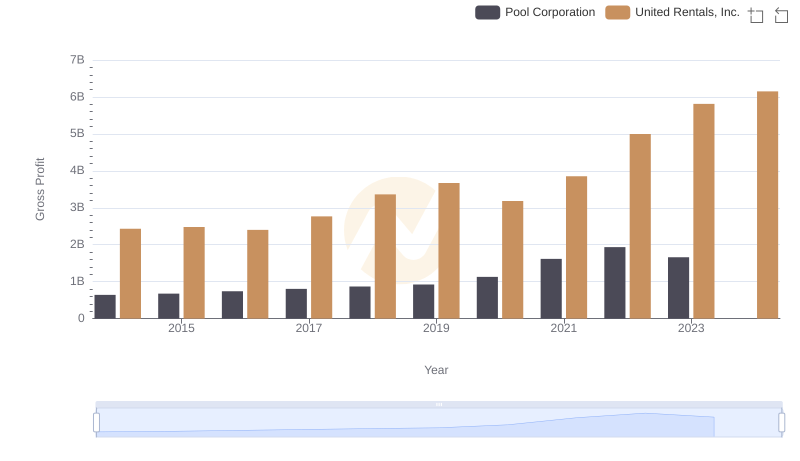
United Rentals, Inc. vs Pool Corporation: A Gross Profit Performance Breakdown
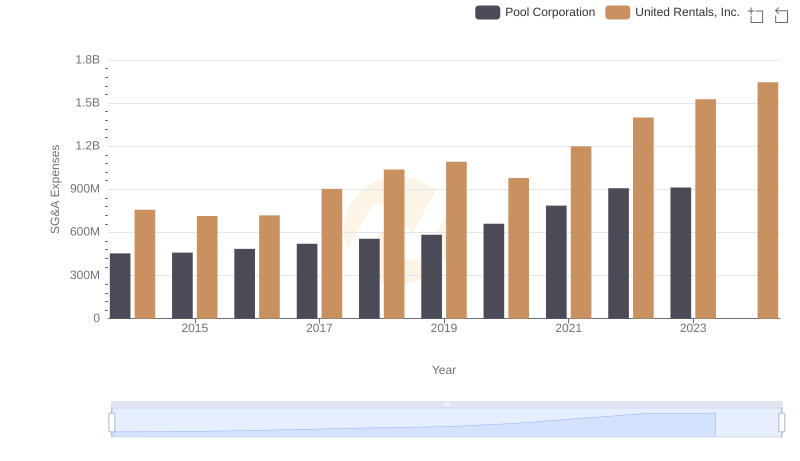
Cost Management Insights: SG&A Expenses for United Rentals, Inc. and Pool Corporation
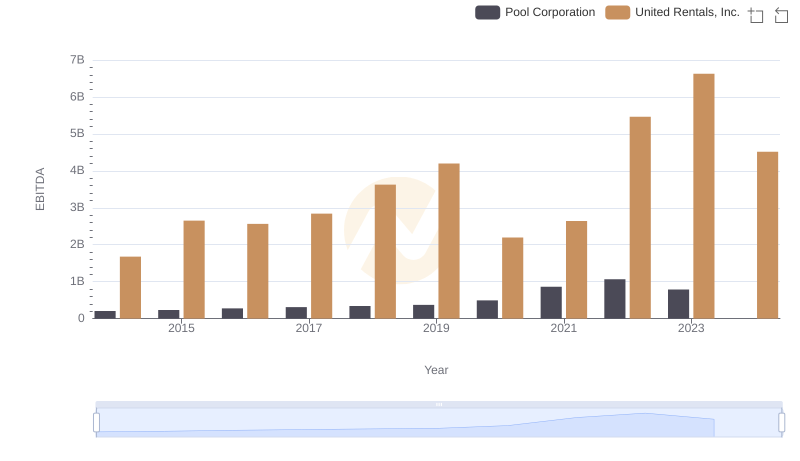
Comparative EBITDA Analysis: United Rentals, Inc. vs Pool Corporation