| __timestamp | Saia, Inc. | United Rentals, Inc. |
|---|---|---|
| Wednesday, January 1, 2014 | 1113053000 | 3253000000 |
| Thursday, January 1, 2015 | 1067191000 | 3337000000 |
| Friday, January 1, 2016 | 1058979000 | 3359000000 |
| Sunday, January 1, 2017 | 1203464000 | 3872000000 |
| Monday, January 1, 2018 | 1423779000 | 4683000000 |
| Tuesday, January 1, 2019 | 1537082000 | 5681000000 |
| Wednesday, January 1, 2020 | 1538518000 | 5347000000 |
| Friday, January 1, 2021 | 1837017000 | 5863000000 |
| Saturday, January 1, 2022 | 2201094000 | 6646000000 |
| Sunday, January 1, 2023 | 2282501000 | 8519000000 |
| Monday, January 1, 2024 | 9195000000 |
Cracking the code
In the competitive landscape of the U.S. stock market, understanding the cost of revenue is crucial for investors. This metric, which represents the direct costs attributable to the production of goods sold by a company, offers insights into operational efficiency. From 2014 to 2023, United Rentals, Inc. and Saia, Inc. have shown distinct trajectories in their cost of revenue.
United Rentals, Inc. has consistently outpaced Saia, Inc. in terms of cost of revenue, reflecting its expansive operations. In 2023, United Rentals reported a staggering 162% increase from 2014, reaching approximately $8.5 billion. This growth underscores its robust market presence and strategic investments.
Conversely, Saia, Inc. has demonstrated a steady rise, with a 105% increase over the same period, culminating in $2.28 billion in 2023. This growth highlights Saia's efficient cost management and expanding footprint in the logistics sector.
The data for 2024 is incomplete, but the trends suggest continued growth for both companies.

Breaking Down Revenue Trends: United Rentals, Inc. vs Saia, Inc.
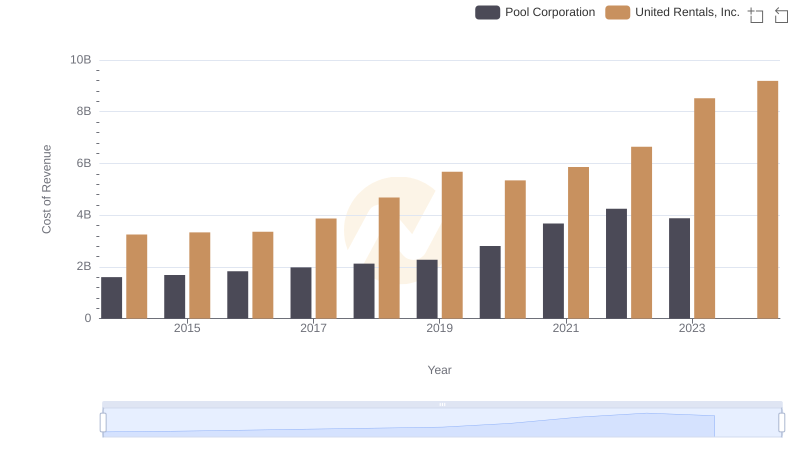
United Rentals, Inc. vs Pool Corporation: Efficiency in Cost of Revenue Explored
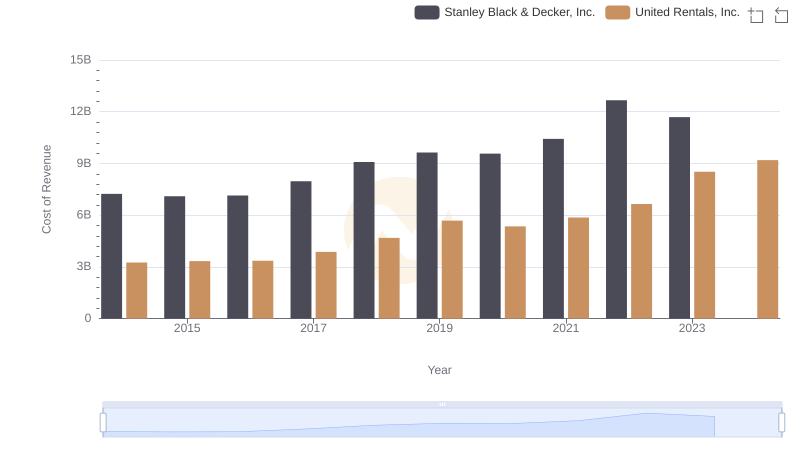
Comparing Cost of Revenue Efficiency: United Rentals, Inc. vs Stanley Black & Decker, Inc.
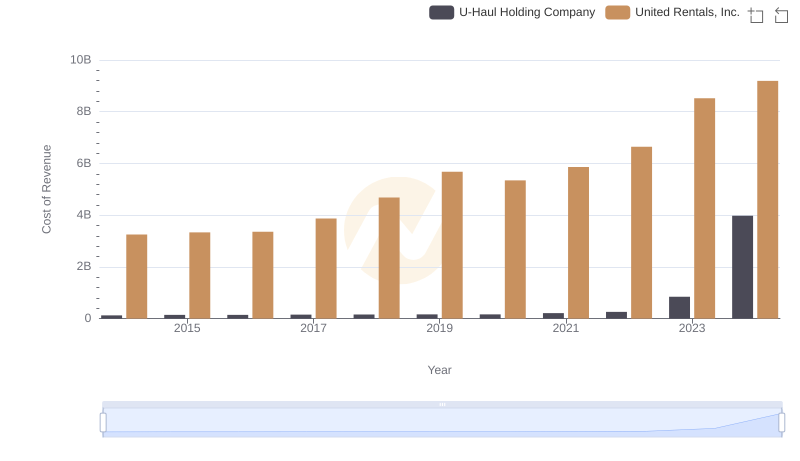
Cost of Revenue Comparison: United Rentals, Inc. vs U-Haul Holding Company
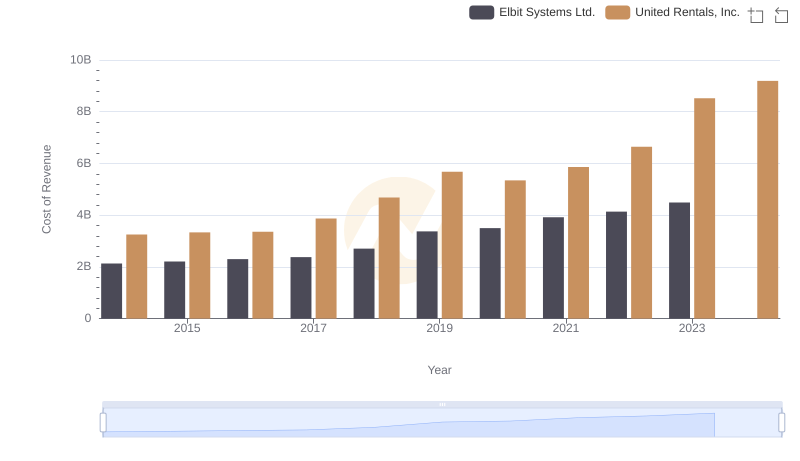
Comparing Cost of Revenue Efficiency: United Rentals, Inc. vs Elbit Systems Ltd.
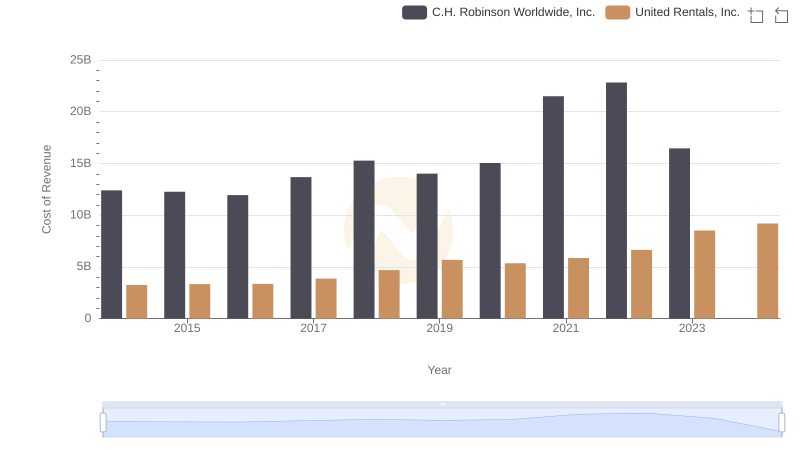
United Rentals, Inc. vs C.H. Robinson Worldwide, Inc.: Efficiency in Cost of Revenue Explored
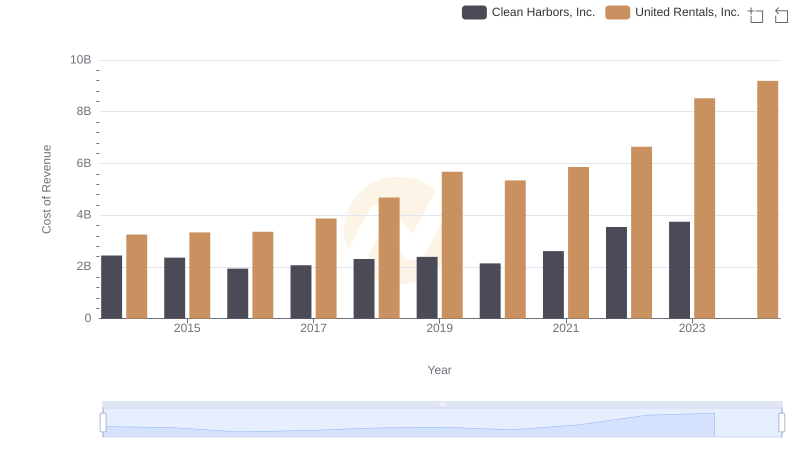
Cost of Revenue: Key Insights for United Rentals, Inc. and Clean Harbors, Inc.
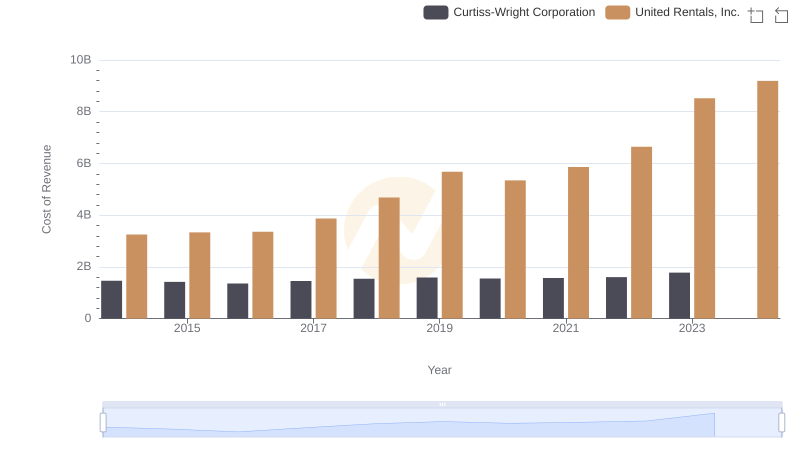
Cost of Revenue Trends: United Rentals, Inc. vs Curtiss-Wright Corporation
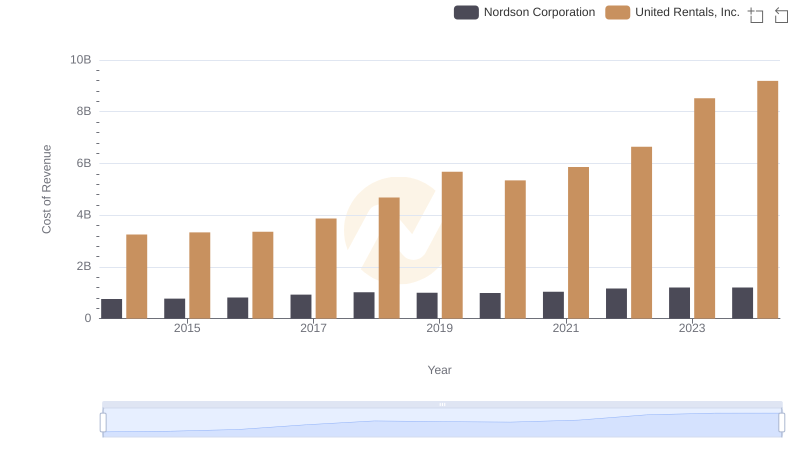
Comparing Cost of Revenue Efficiency: United Rentals, Inc. vs Nordson Corporation
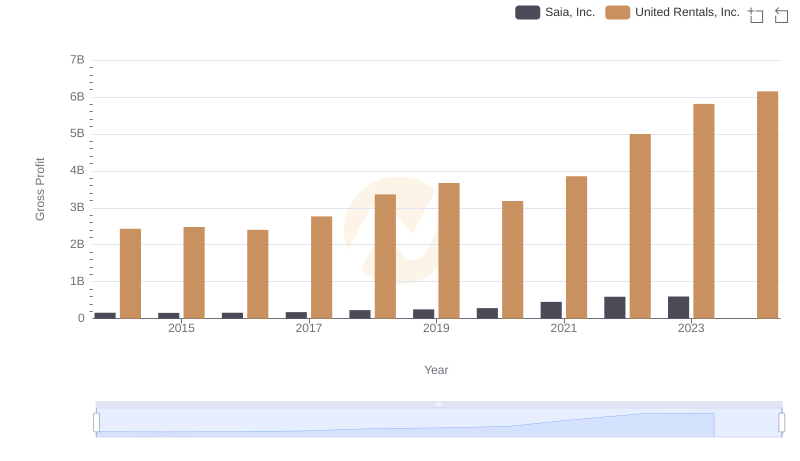
Gross Profit Comparison: United Rentals, Inc. and Saia, Inc. Trends
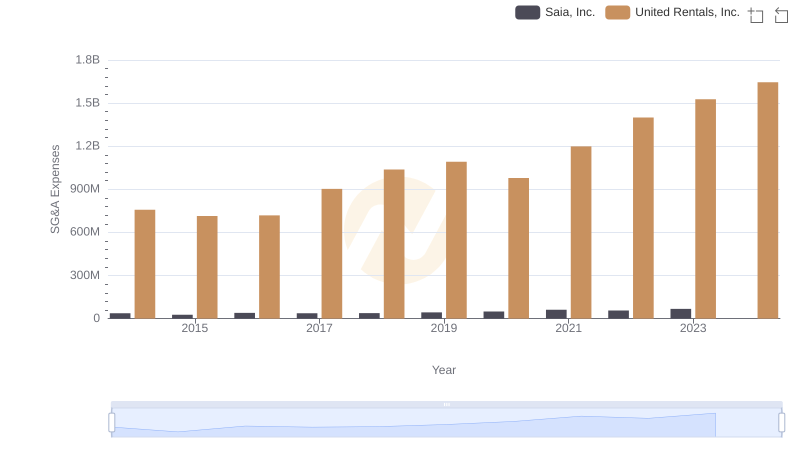
Breaking Down SG&A Expenses: United Rentals, Inc. vs Saia, Inc.
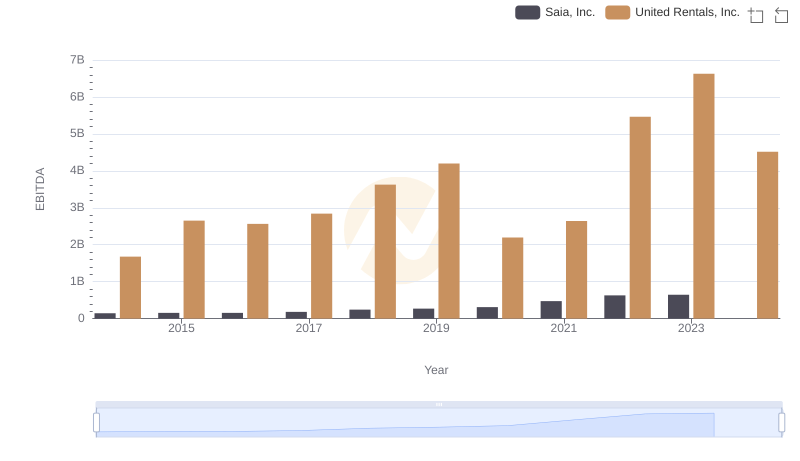
United Rentals, Inc. vs Saia, Inc.: In-Depth EBITDA Performance Comparison