| __timestamp | Cisco Systems, Inc. | ON Semiconductor Corporation |
|---|---|---|
| Wednesday, January 1, 2014 | 19373000000 | 2076900000 |
| Thursday, January 1, 2015 | 19480000000 | 2302600000 |
| Friday, January 1, 2016 | 18287000000 | 2610000000 |
| Sunday, January 1, 2017 | 17781000000 | 3509300000 |
| Monday, January 1, 2018 | 18724000000 | 3639600000 |
| Tuesday, January 1, 2019 | 19238000000 | 3544300000 |
| Wednesday, January 1, 2020 | 17618000000 | 3539200000 |
| Friday, January 1, 2021 | 17924000000 | 4025500000 |
| Saturday, January 1, 2022 | 19309000000 | 4249000000 |
| Sunday, January 1, 2023 | 21245000000 | 4369500000 |
| Monday, January 1, 2024 | 18975000000 | 3866200000 |
Unveiling the hidden dimensions of data
In the ever-evolving landscape of technology and semiconductor industries, understanding cost dynamics is crucial. Cisco Systems, Inc., a leader in networking hardware, and ON Semiconductor Corporation, a key player in semiconductor solutions, have shown intriguing cost of revenue trends over the past decade.
From 2014 to 2023, Cisco's cost of revenue fluctuated, peaking in 2023 with a 10% increase from 2014. Meanwhile, ON Semiconductor saw a remarkable 110% rise in the same period, reflecting its aggressive growth strategy. Notably, Cisco's costs dipped in 2020, possibly due to global supply chain disruptions, while ON Semiconductor's costs surged in 2021, aligning with increased demand for semiconductors.
These trends highlight the contrasting strategies and market responses of these industry titans, offering valuable insights for investors and industry analysts alike.
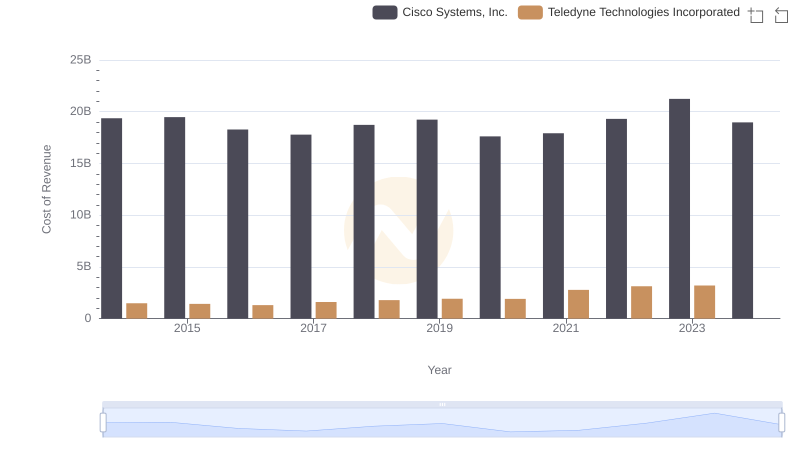
Cost of Revenue Comparison: Cisco Systems, Inc. vs Teledyne Technologies Incorporated
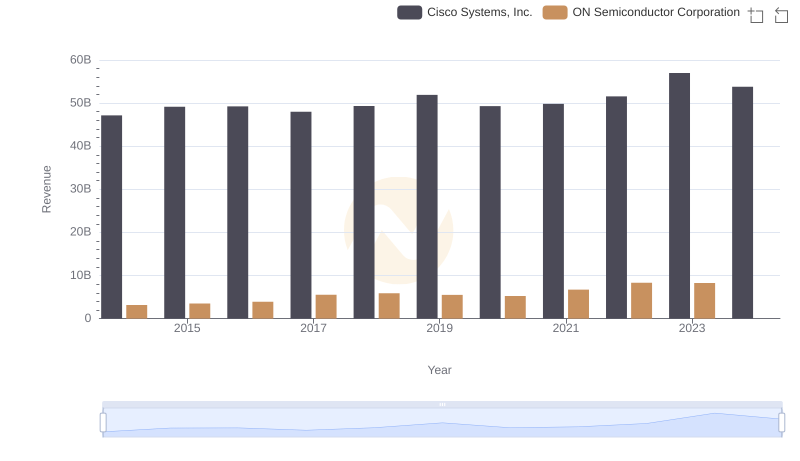
Cisco Systems, Inc. vs ON Semiconductor Corporation: Annual Revenue Growth Compared
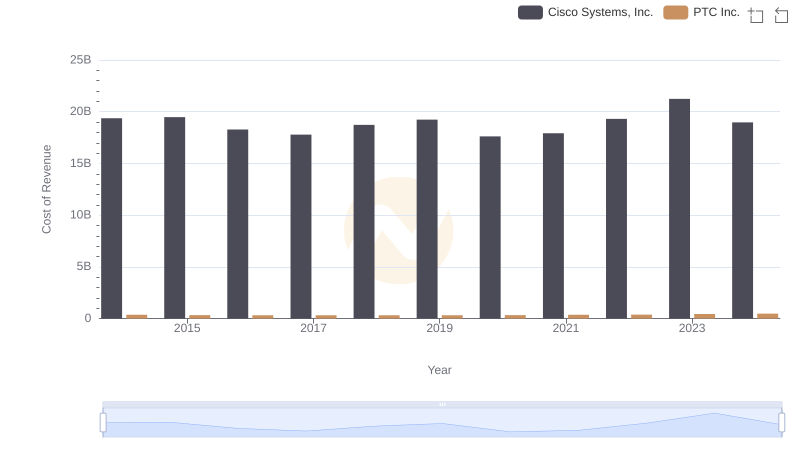
Cost Insights: Breaking Down Cisco Systems, Inc. and PTC Inc.'s Expenses
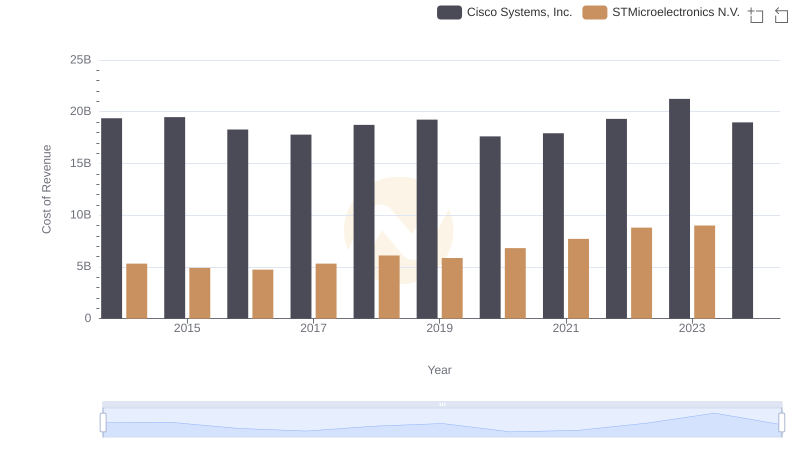
Cisco Systems, Inc. vs STMicroelectronics N.V.: Efficiency in Cost of Revenue Explored
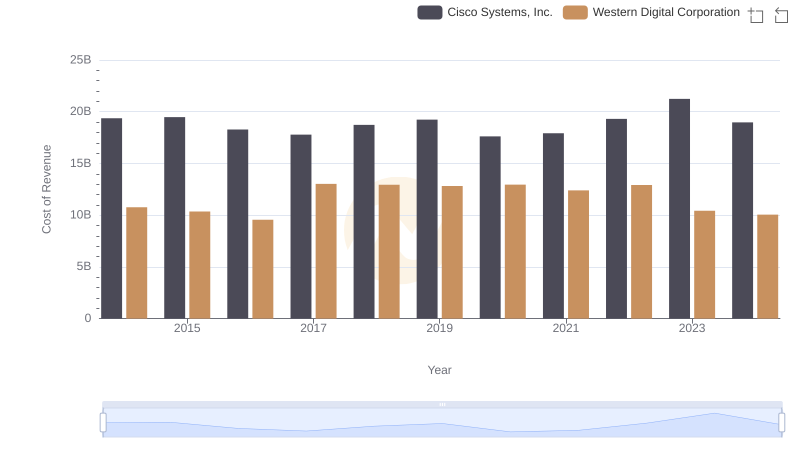
Cost of Revenue: Key Insights for Cisco Systems, Inc. and Western Digital Corporation
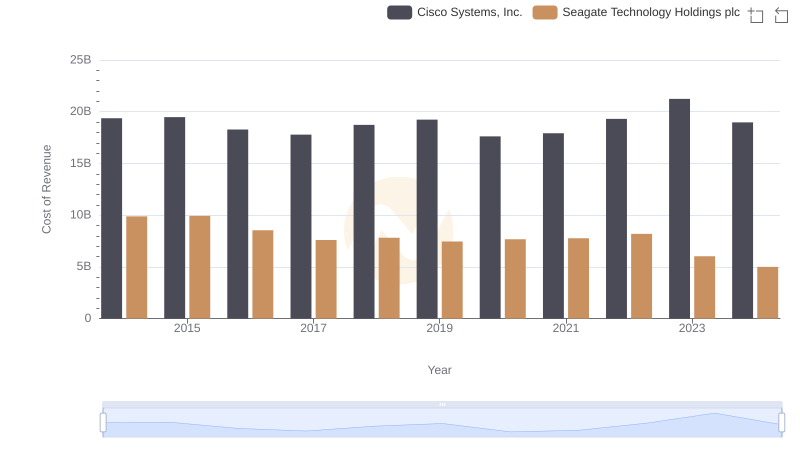
Analyzing Cost of Revenue: Cisco Systems, Inc. and Seagate Technology Holdings plc
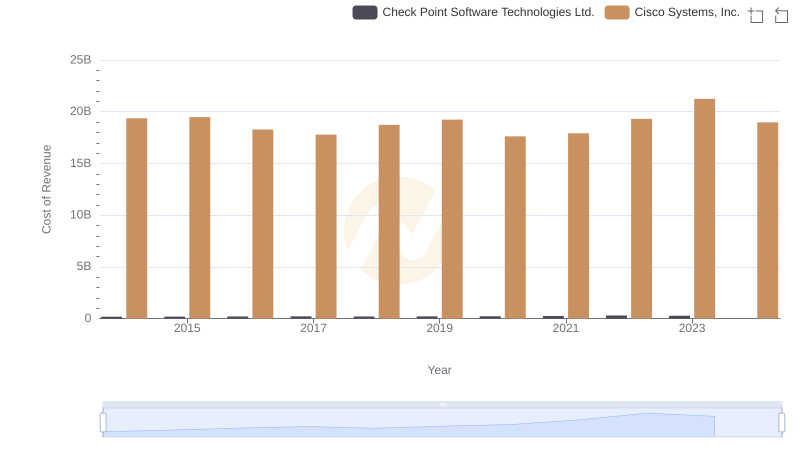
Cisco Systems, Inc. vs Check Point Software Technologies Ltd.: Efficiency in Cost of Revenue Explored
Gross Profit Analysis: Comparing Cisco Systems, Inc. and ON Semiconductor Corporation
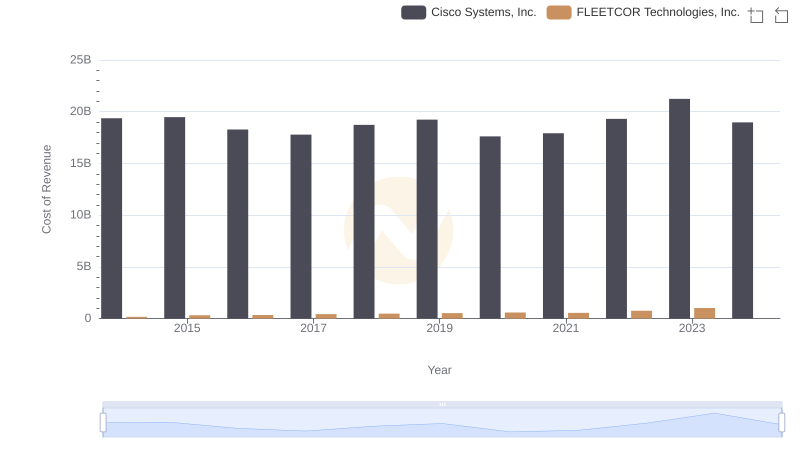
Cost Insights: Breaking Down Cisco Systems, Inc. and FLEETCOR Technologies, Inc.'s Expenses
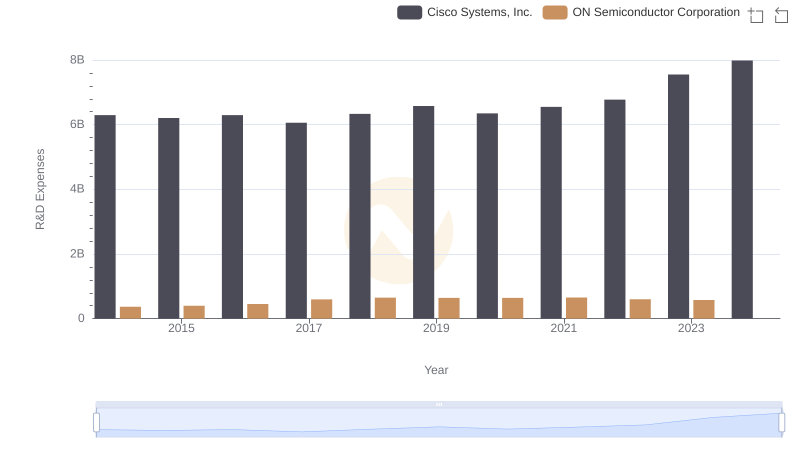
R&D Insights: How Cisco Systems, Inc. and ON Semiconductor Corporation Allocate Funds
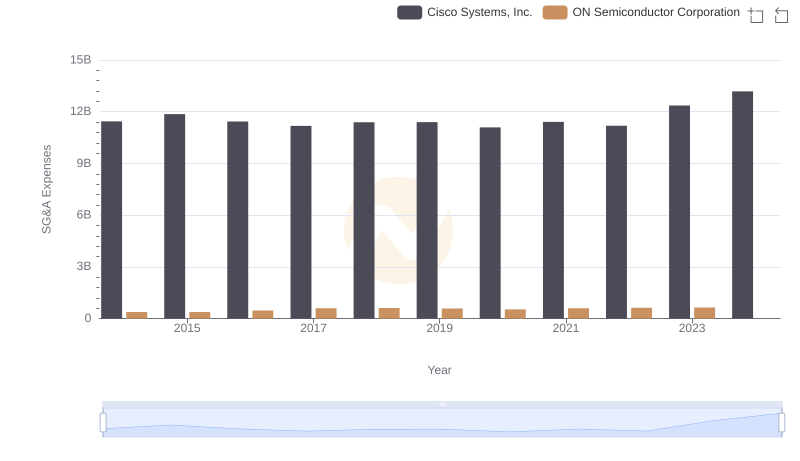
Selling, General, and Administrative Costs: Cisco Systems, Inc. vs ON Semiconductor Corporation
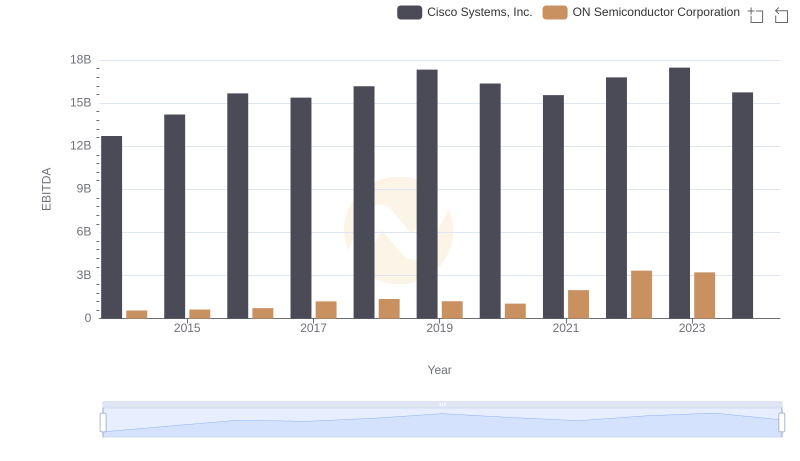
Professional EBITDA Benchmarking: Cisco Systems, Inc. vs ON Semiconductor Corporation