| __timestamp | Cisco Systems, Inc. | PTC Inc. |
|---|---|---|
| Wednesday, January 1, 2014 | 19373000000 | 373683000 |
| Thursday, January 1, 2015 | 19480000000 | 334734000 |
| Friday, January 1, 2016 | 18287000000 | 325665000 |
| Sunday, January 1, 2017 | 17781000000 | 329019000 |
| Monday, January 1, 2018 | 18724000000 | 326194000 |
| Tuesday, January 1, 2019 | 19238000000 | 325378000 |
| Wednesday, January 1, 2020 | 17618000000 | 334271000 |
| Friday, January 1, 2021 | 17924000000 | 371102000 |
| Saturday, January 1, 2022 | 19309000000 | 385980000 |
| Sunday, January 1, 2023 | 21245000000 | 441006000 |
| Monday, January 1, 2024 | 18975000000 | 486834000 |
Igniting the spark of knowledge
In the ever-evolving tech industry, understanding cost structures is crucial for investors and analysts alike. This analysis delves into the cost of revenue trends for two giants: Cisco Systems, Inc. and PTC Inc., from 2014 to 2024. Over this decade, Cisco's cost of revenue has shown a slight decline, with a notable dip in 2020, likely due to global economic shifts. However, by 2023, Cisco rebounded with a 20% increase, reaching its peak. In contrast, PTC Inc. maintained a more stable trajectory, with a gradual rise in costs, culminating in a 30% increase by 2024. This divergence highlights Cisco's adaptability in cost management, while PTC's steady growth reflects its consistent market strategy. Such insights are invaluable for stakeholders aiming to navigate the complexities of tech investments.
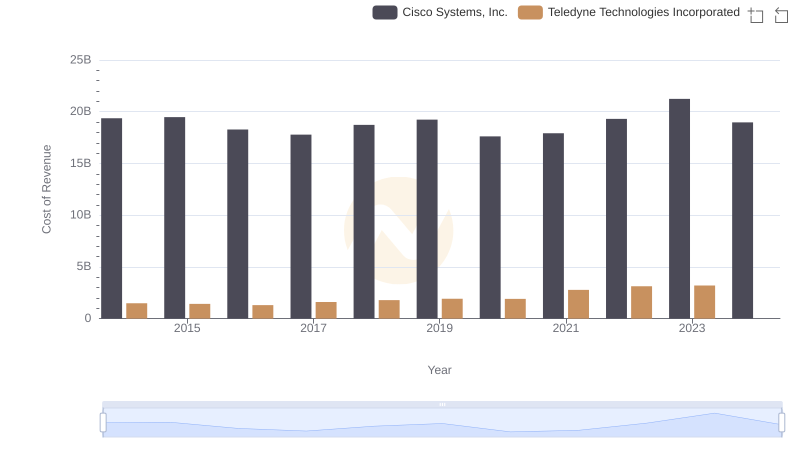
Cost of Revenue Comparison: Cisco Systems, Inc. vs Teledyne Technologies Incorporated
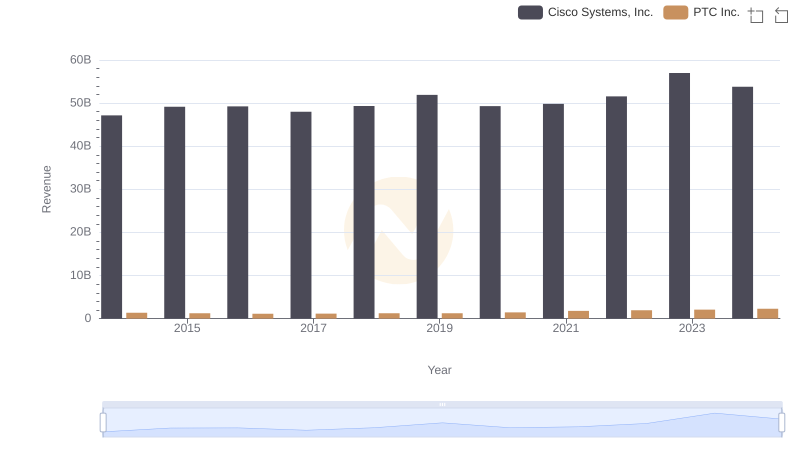
Cisco Systems, Inc. and PTC Inc.: A Comprehensive Revenue Analysis
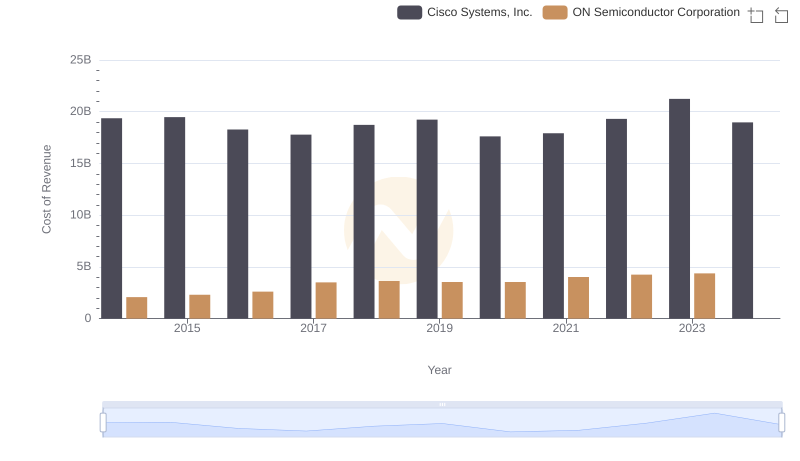
Cost of Revenue Trends: Cisco Systems, Inc. vs ON Semiconductor Corporation
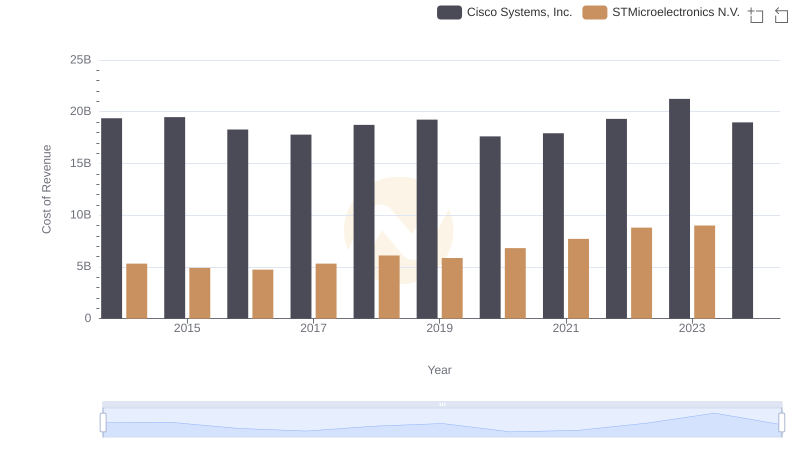
Cisco Systems, Inc. vs STMicroelectronics N.V.: Efficiency in Cost of Revenue Explored
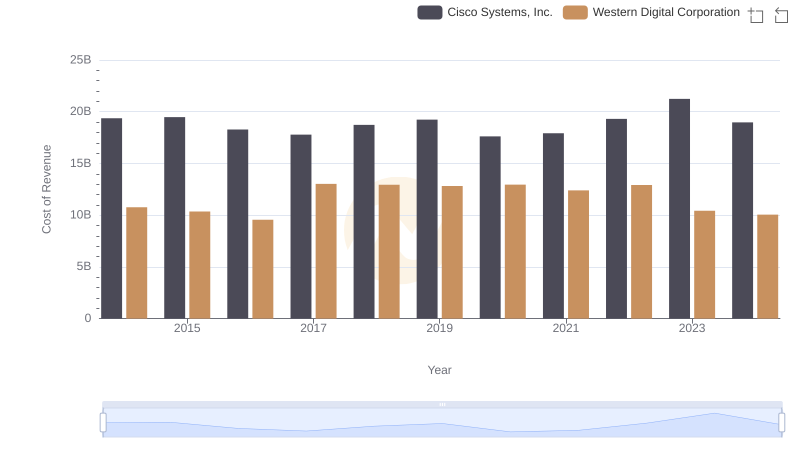
Cost of Revenue: Key Insights for Cisco Systems, Inc. and Western Digital Corporation
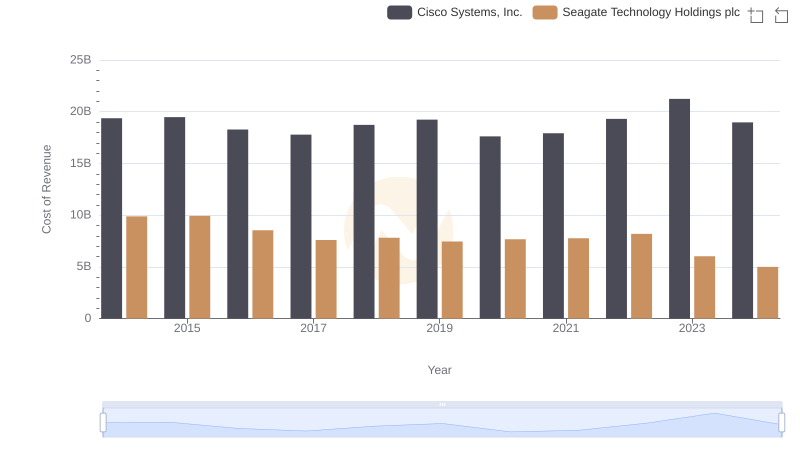
Analyzing Cost of Revenue: Cisco Systems, Inc. and Seagate Technology Holdings plc
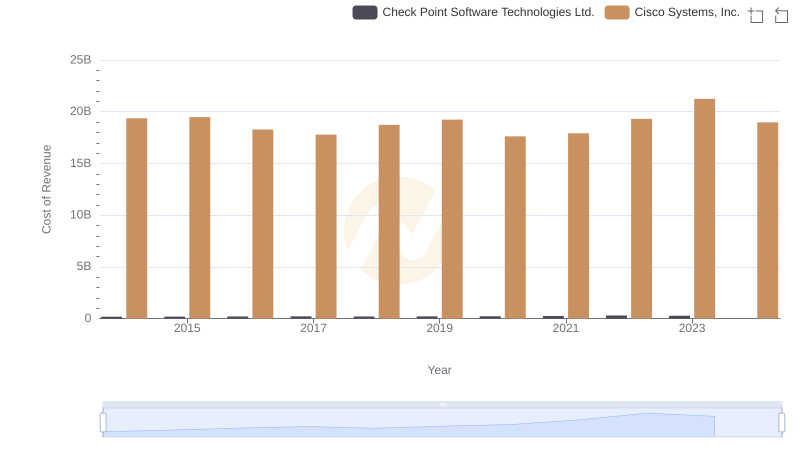
Cisco Systems, Inc. vs Check Point Software Technologies Ltd.: Efficiency in Cost of Revenue Explored
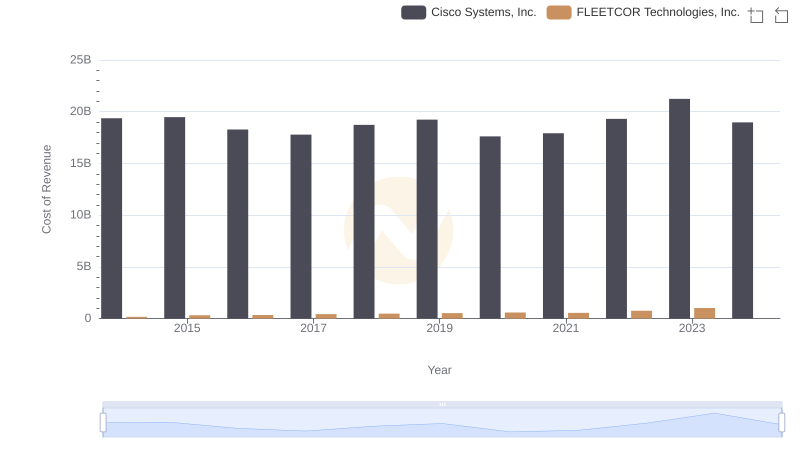
Cost Insights: Breaking Down Cisco Systems, Inc. and FLEETCOR Technologies, Inc.'s Expenses
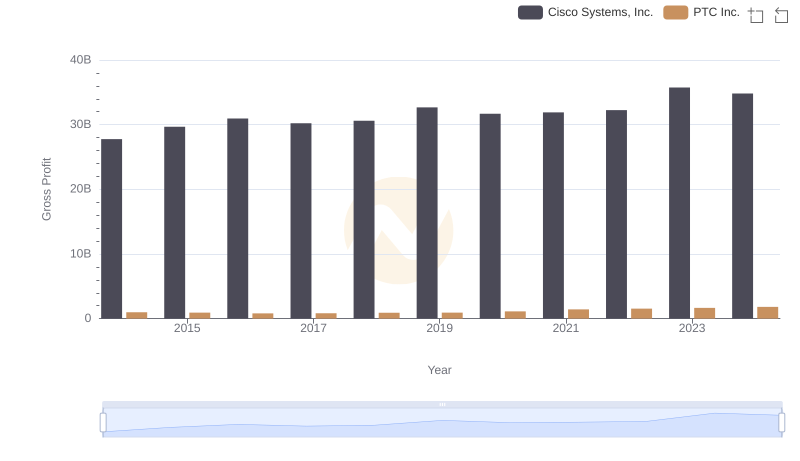
Who Generates Higher Gross Profit? Cisco Systems, Inc. or PTC Inc.
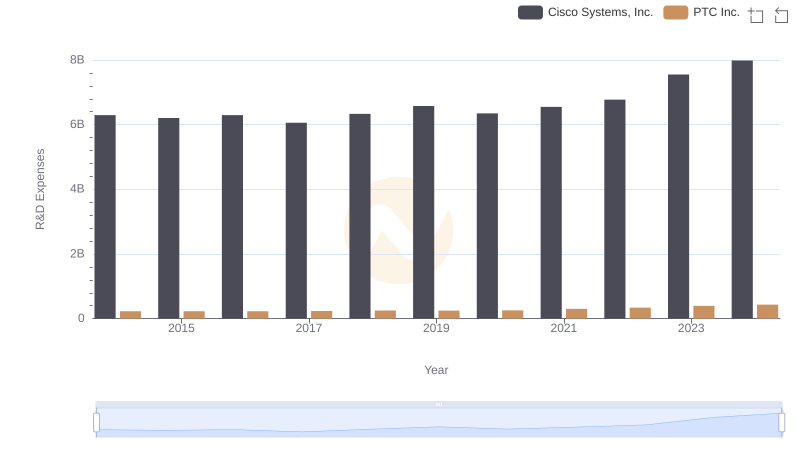
Research and Development Expenses Breakdown: Cisco Systems, Inc. vs PTC Inc.
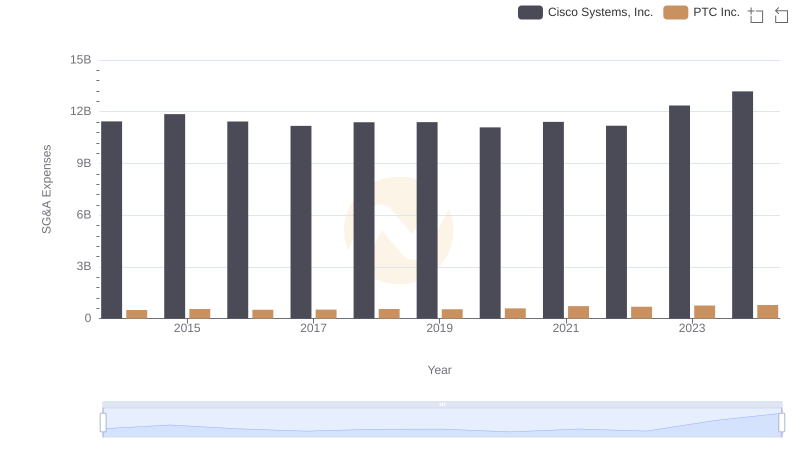
Cisco Systems, Inc. vs PTC Inc.: SG&A Expense Trends
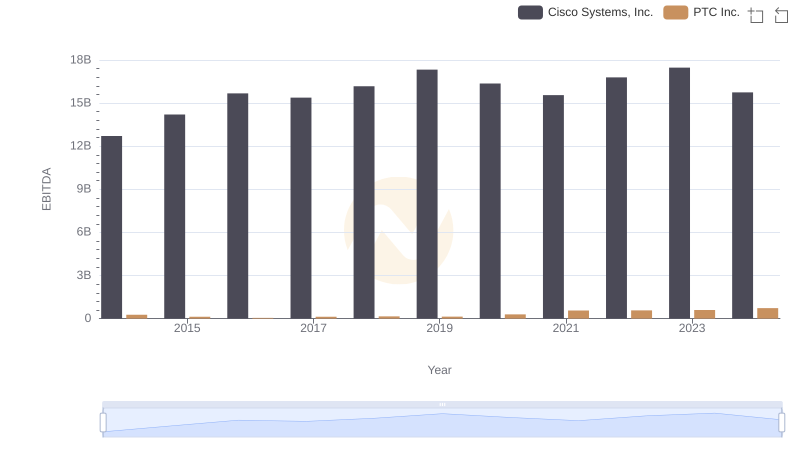
A Professional Review of EBITDA: Cisco Systems, Inc. Compared to PTC Inc.