| __timestamp | Cisco Systems, Inc. | NetApp, Inc. |
|---|---|---|
| Wednesday, January 1, 2014 | 11437000000 | 2179200000 |
| Thursday, January 1, 2015 | 11861000000 | 2197400000 |
| Friday, January 1, 2016 | 11433000000 | 2099000000 |
| Sunday, January 1, 2017 | 11177000000 | 1904000000 |
| Monday, January 1, 2018 | 11386000000 | 2009000000 |
| Tuesday, January 1, 2019 | 11398000000 | 1935000000 |
| Wednesday, January 1, 2020 | 11094000000 | 1848000000 |
| Friday, January 1, 2021 | 11411000000 | 2001000000 |
| Saturday, January 1, 2022 | 11186000000 | 2136000000 |
| Sunday, January 1, 2023 | 12358000000 | 2094000000 |
| Monday, January 1, 2024 | 13177000000 | 2136000000 |
Cracking the code
In the ever-evolving landscape of technology, effective cost management is crucial for maintaining competitive advantage. This analysis delves into the Selling, General, and Administrative (SG&A) expenses of two industry titans, Cisco Systems, Inc. and NetApp, Inc., from 2014 to 2024. Over this decade, Cisco's SG&A expenses have shown a steady increase, peaking at approximately $13.2 billion in 2024, marking a 15% rise from 2014. In contrast, NetApp's expenses have remained relatively stable, fluctuating around $2 billion annually. This stability reflects NetApp's consistent cost management strategy, while Cisco's upward trend suggests a strategic investment in growth and innovation. As we move forward, understanding these financial dynamics offers valuable insights into the strategic priorities and operational efficiencies of these tech giants.
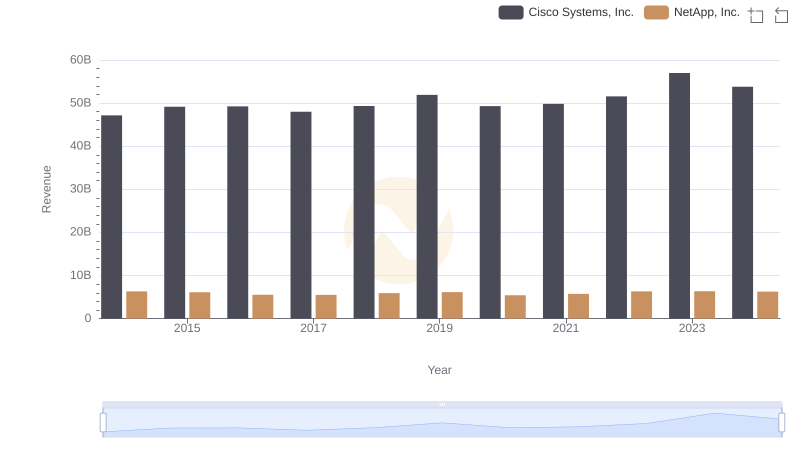
Who Generates More Revenue? Cisco Systems, Inc. or NetApp, Inc.
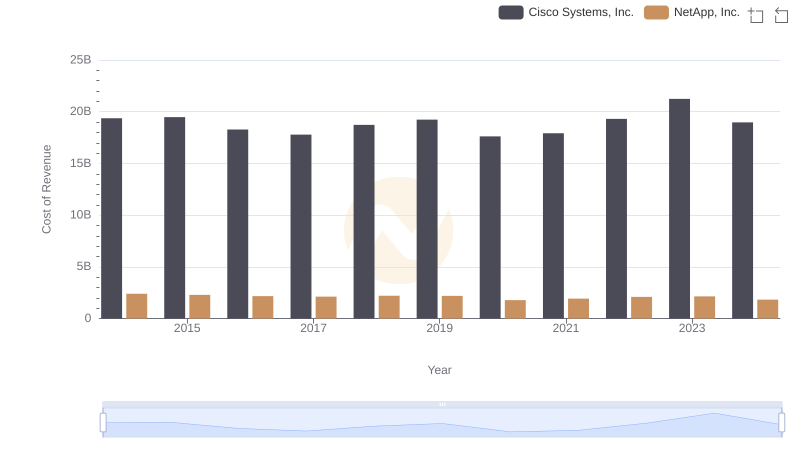
Comparing Cost of Revenue Efficiency: Cisco Systems, Inc. vs NetApp, Inc.
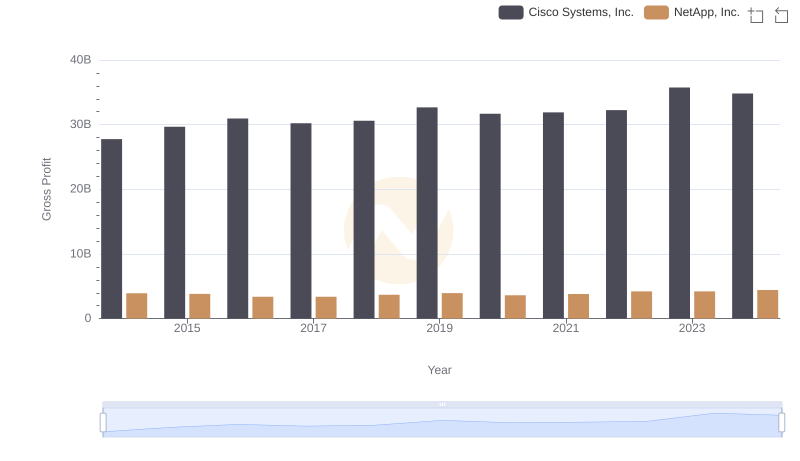
Gross Profit Analysis: Comparing Cisco Systems, Inc. and NetApp, Inc.
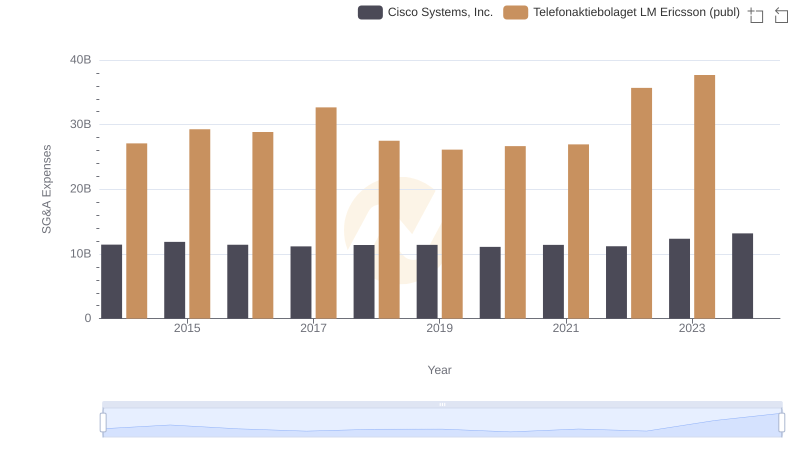
Operational Costs Compared: SG&A Analysis of Cisco Systems, Inc. and Telefonaktiebolaget LM Ericsson (publ)
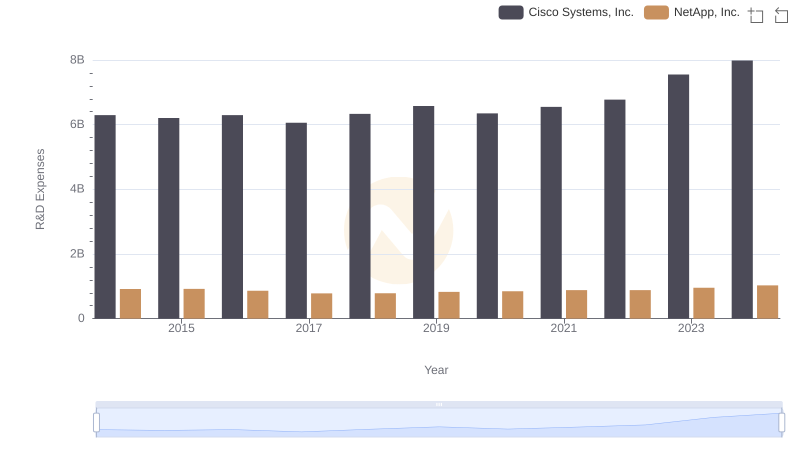
R&D Spending Showdown: Cisco Systems, Inc. vs NetApp, Inc.
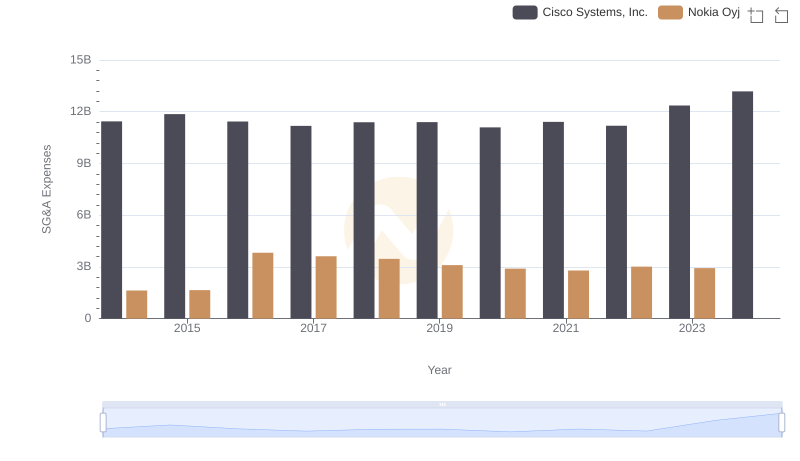
Cisco Systems, Inc. or Nokia Oyj: Who Manages SG&A Costs Better?
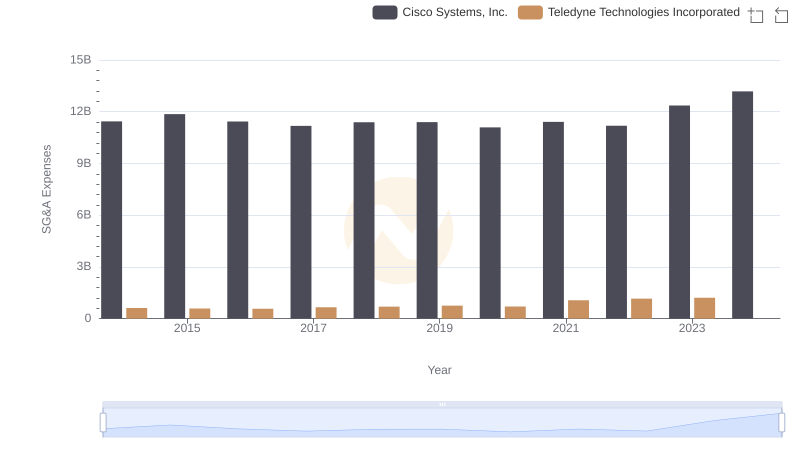
Operational Costs Compared: SG&A Analysis of Cisco Systems, Inc. and Teledyne Technologies Incorporated
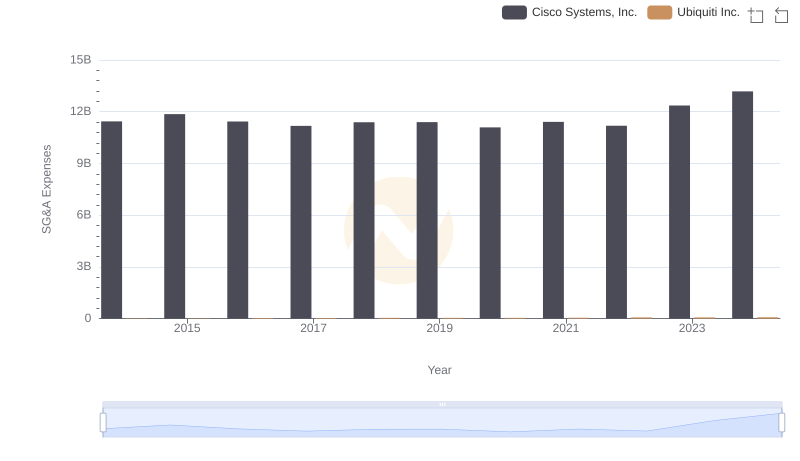
Cisco Systems, Inc. vs Ubiquiti Inc.: SG&A Expense Trends
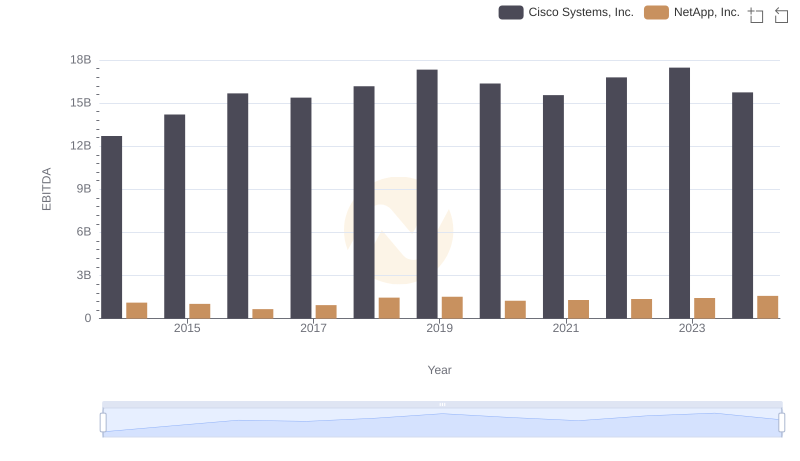
A Side-by-Side Analysis of EBITDA: Cisco Systems, Inc. and NetApp, Inc.
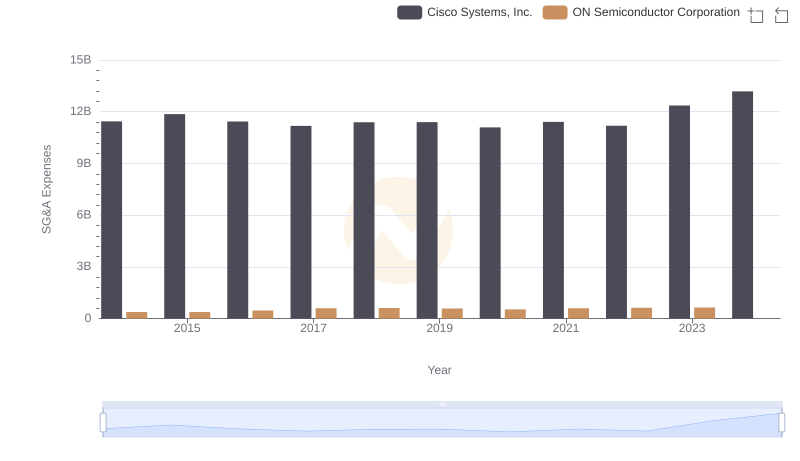
Selling, General, and Administrative Costs: Cisco Systems, Inc. vs ON Semiconductor Corporation
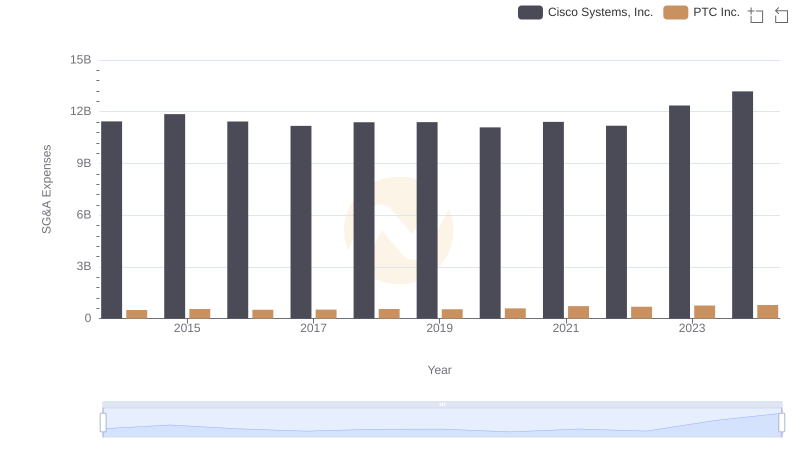
Cisco Systems, Inc. vs PTC Inc.: SG&A Expense Trends

Cisco Systems, Inc. vs FLEETCOR Technologies, Inc.: SG&A Expense Trends