| __timestamp | Cisco Systems, Inc. | NetApp, Inc. |
|---|---|---|
| Wednesday, January 1, 2014 | 12709000000 | 1110900000 |
| Thursday, January 1, 2015 | 14209000000 | 1023700000 |
| Friday, January 1, 2016 | 15678000000 | 662000000 |
| Sunday, January 1, 2017 | 15383000000 | 943000000 |
| Monday, January 1, 2018 | 16172000000 | 1459000000 |
| Tuesday, January 1, 2019 | 17334000000 | 1523000000 |
| Wednesday, January 1, 2020 | 16363000000 | 1243000000 |
| Friday, January 1, 2021 | 15558000000 | 1295000000 |
| Saturday, January 1, 2022 | 16794000000 | 1364000000 |
| Sunday, January 1, 2023 | 17471000000 | 1434000000 |
| Monday, January 1, 2024 | 15747000000 | 1582000000 |
Unlocking the unknown
In the ever-evolving tech industry, understanding financial health is crucial. Cisco Systems, Inc. and NetApp, Inc., two giants in the field, have shown distinct EBITDA trends over the past decade. From 2014 to 2023, Cisco consistently outperformed NetApp, with EBITDA figures peaking at approximately $17.5 billion in 2023, a 37% increase from 2014. In contrast, NetApp's EBITDA, while more modest, grew by 29% over the same period, reaching around $1.4 billion in 2023. This side-by-side analysis highlights Cisco's robust financial growth, driven by its expansive product portfolio and strategic acquisitions. Meanwhile, NetApp's steady rise reflects its focus on data management solutions. As we look to 2024, both companies continue to adapt to market demands, with NetApp showing a promising 10% increase in EBITDA. This financial snapshot offers valuable insights for investors and industry analysts alike.
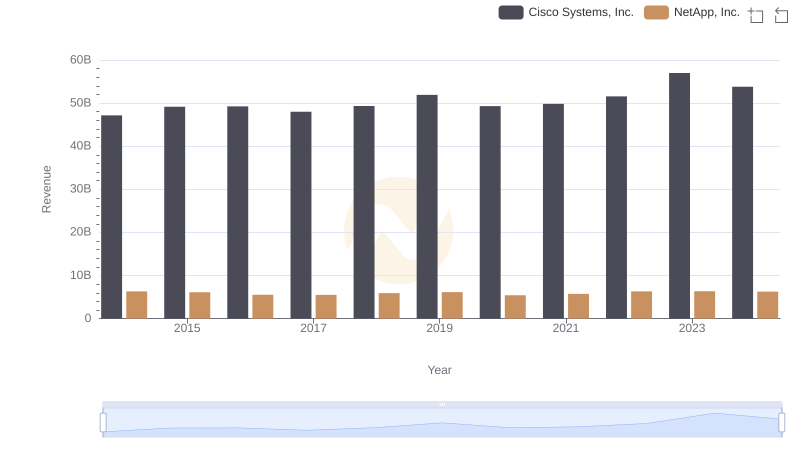
Who Generates More Revenue? Cisco Systems, Inc. or NetApp, Inc.
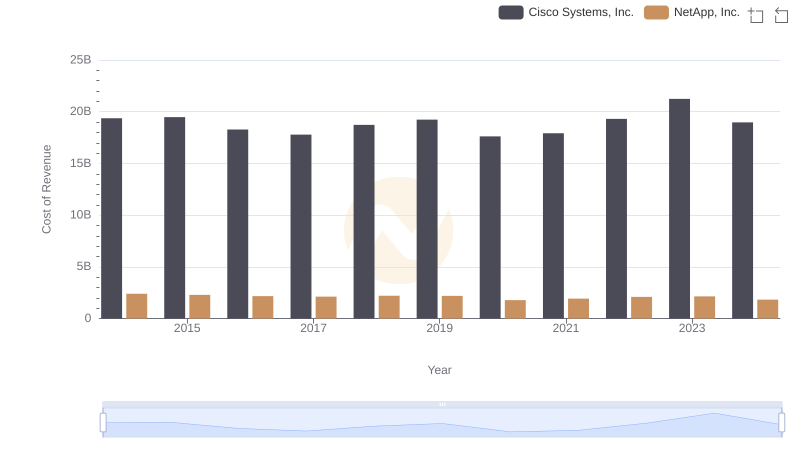
Comparing Cost of Revenue Efficiency: Cisco Systems, Inc. vs NetApp, Inc.
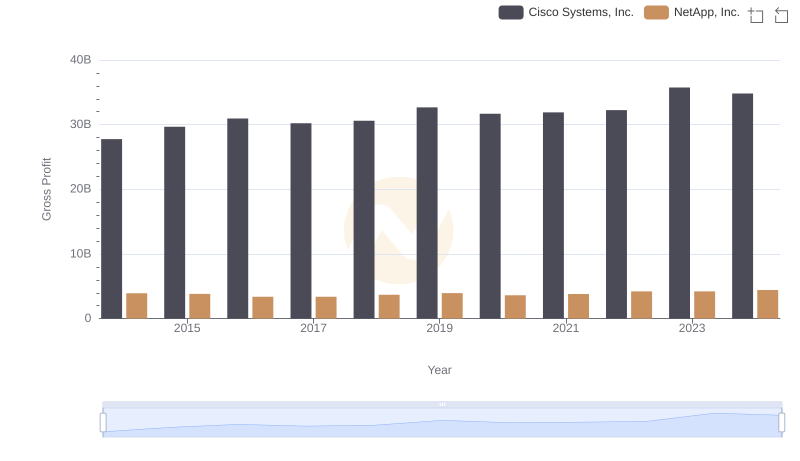
Gross Profit Analysis: Comparing Cisco Systems, Inc. and NetApp, Inc.
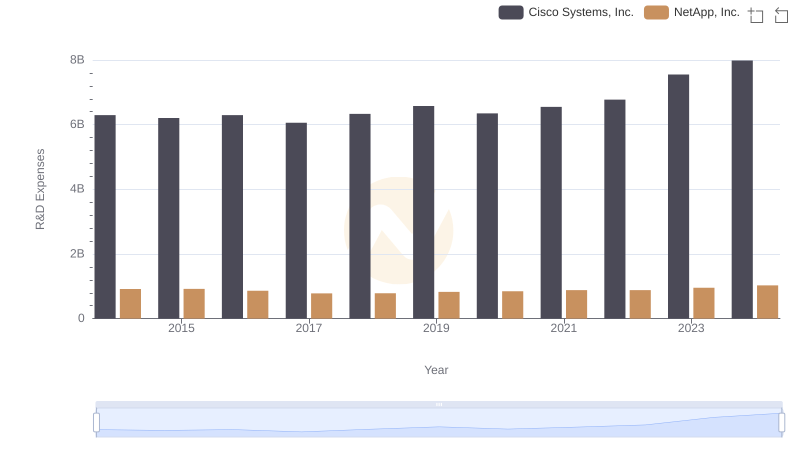
R&D Spending Showdown: Cisco Systems, Inc. vs NetApp, Inc.
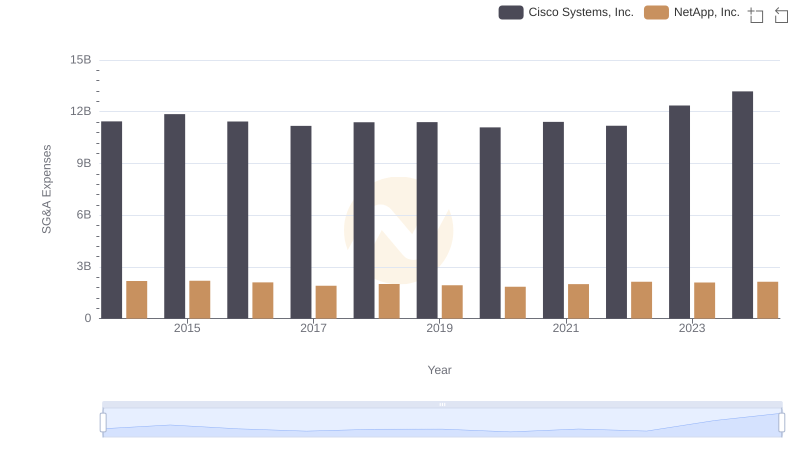
Cost Management Insights: SG&A Expenses for Cisco Systems, Inc. and NetApp, Inc.
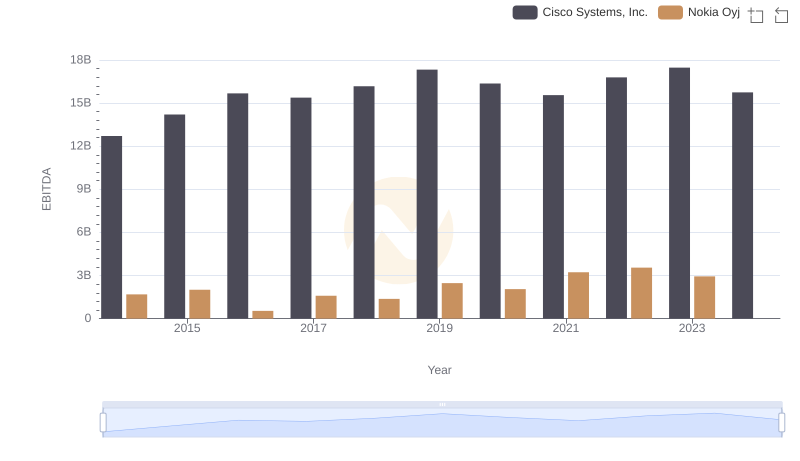
Professional EBITDA Benchmarking: Cisco Systems, Inc. vs Nokia Oyj
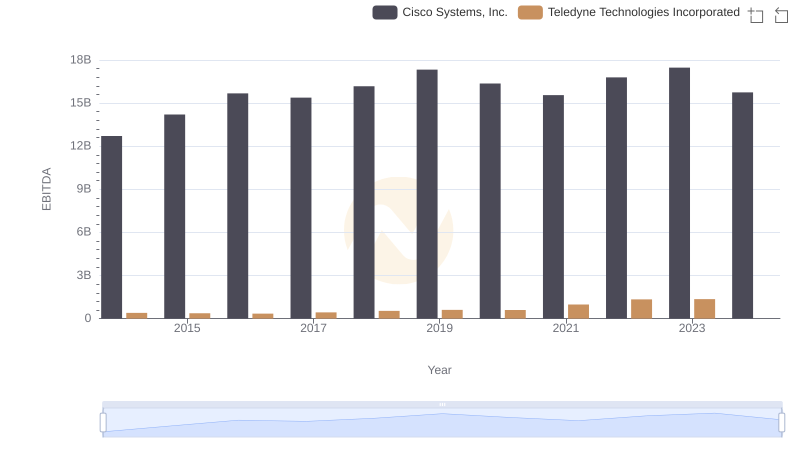
Cisco Systems, Inc. and Teledyne Technologies Incorporated: A Detailed Examination of EBITDA Performance
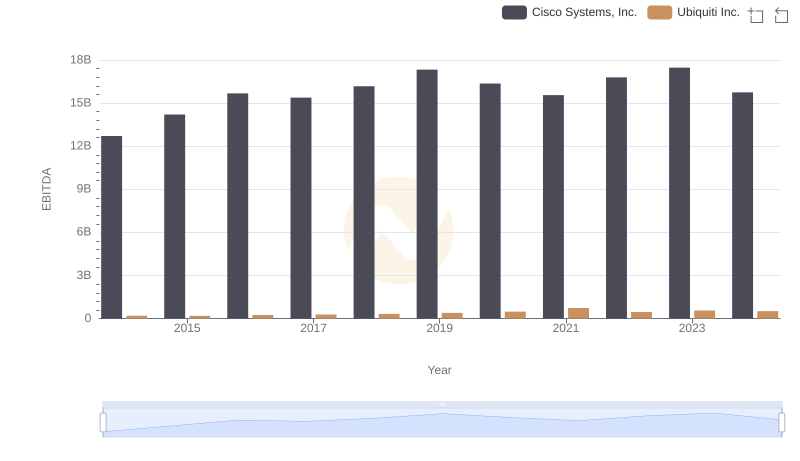
Comprehensive EBITDA Comparison: Cisco Systems, Inc. vs Ubiquiti Inc.

Professional EBITDA Benchmarking: Cisco Systems, Inc. vs ON Semiconductor Corporation
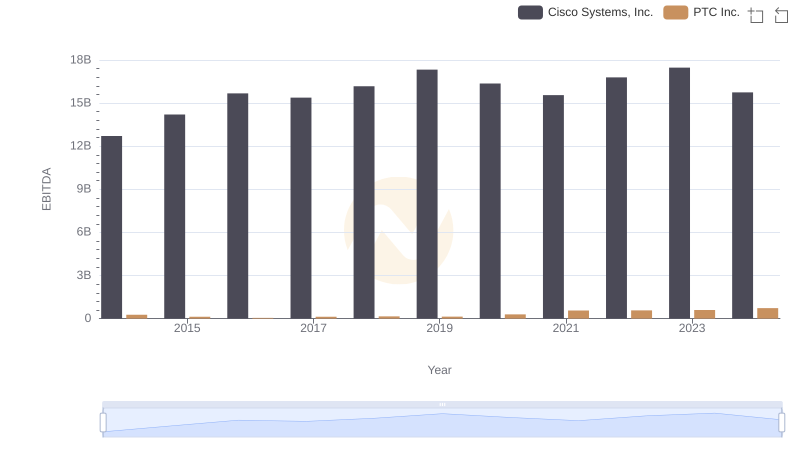
A Professional Review of EBITDA: Cisco Systems, Inc. Compared to PTC Inc.
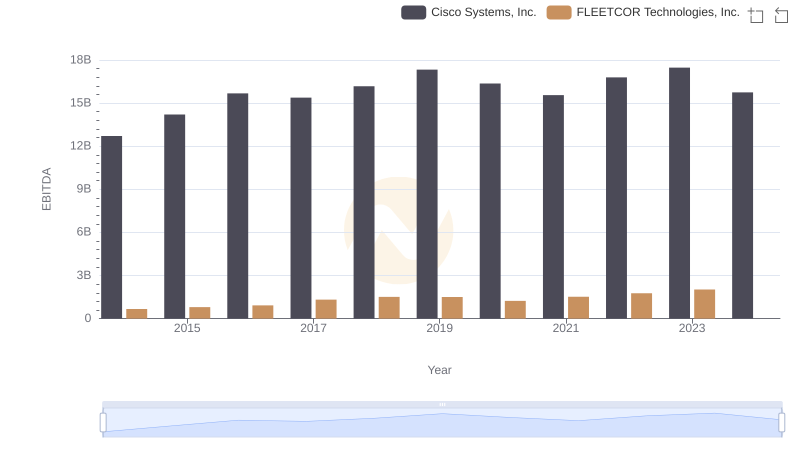
EBITDA Metrics Evaluated: Cisco Systems, Inc. vs FLEETCOR Technologies, Inc.
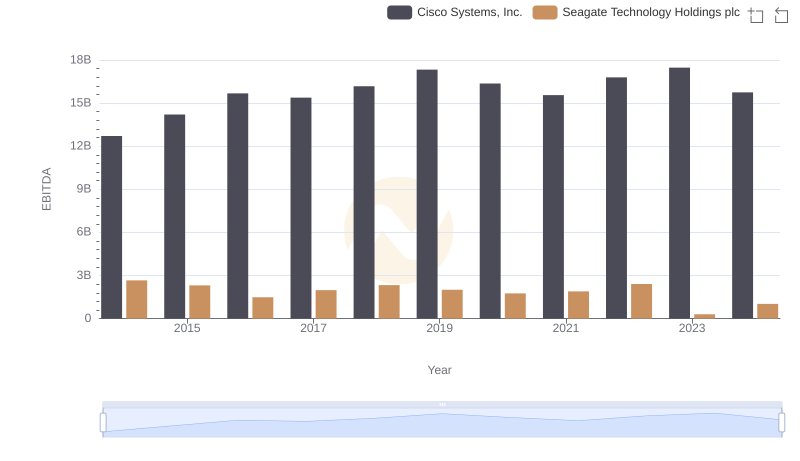
Cisco Systems, Inc. and Seagate Technology Holdings plc: A Detailed Examination of EBITDA Performance