| __timestamp | Cisco Systems, Inc. | Teledyne Technologies Incorporated |
|---|---|---|
| Wednesday, January 1, 2014 | 19373000000 | 1487100000 |
| Thursday, January 1, 2015 | 19480000000 | 1427800000 |
| Friday, January 1, 2016 | 18287000000 | 1308800000 |
| Sunday, January 1, 2017 | 17781000000 | 1612200000 |
| Monday, January 1, 2018 | 18724000000 | 1791000000 |
| Tuesday, January 1, 2019 | 19238000000 | 1920300000 |
| Wednesday, January 1, 2020 | 17618000000 | 1905300000 |
| Friday, January 1, 2021 | 17924000000 | 2772900000 |
| Saturday, January 1, 2022 | 19309000000 | 3128300000 |
| Sunday, January 1, 2023 | 21245000000 | 3196100000 |
| Monday, January 1, 2024 | 18975000000 |
Unleashing insights
In the ever-evolving landscape of technology, Cisco Systems, Inc. and Teledyne Technologies Incorporated stand as titans, each with a unique trajectory in cost management. From 2014 to 2023, Cisco's cost of revenue has shown a steady pattern, peaking in 2023 with a 10% increase from its 2014 figures. Meanwhile, Teledyne's cost of revenue has surged by over 115% during the same period, reflecting its aggressive expansion and adaptation strategies.
Cisco's cost of revenue remained relatively stable, with minor fluctuations, indicating a consistent operational strategy. In contrast, Teledyne's costs have escalated, particularly from 2021 onwards, suggesting significant investments in growth and innovation. The absence of data for Teledyne in 2024 hints at potential strategic shifts or reporting changes. This comparison not only highlights the financial strategies of these industry leaders but also offers insights into their future trajectories.
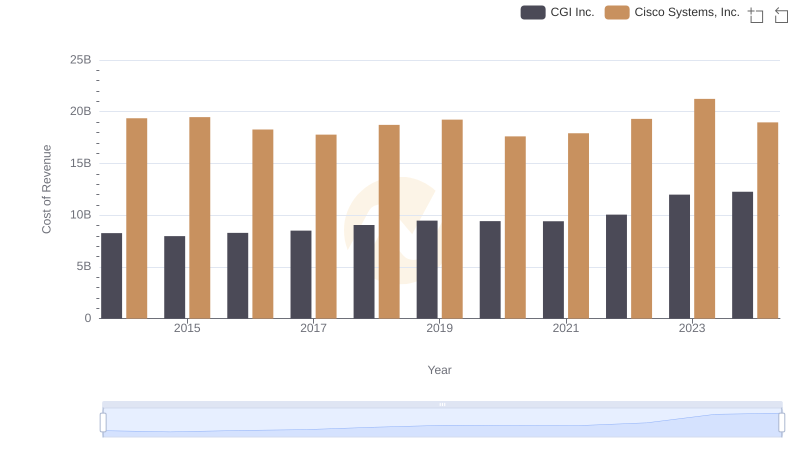
Cisco Systems, Inc. vs CGI Inc.: Efficiency in Cost of Revenue Explored
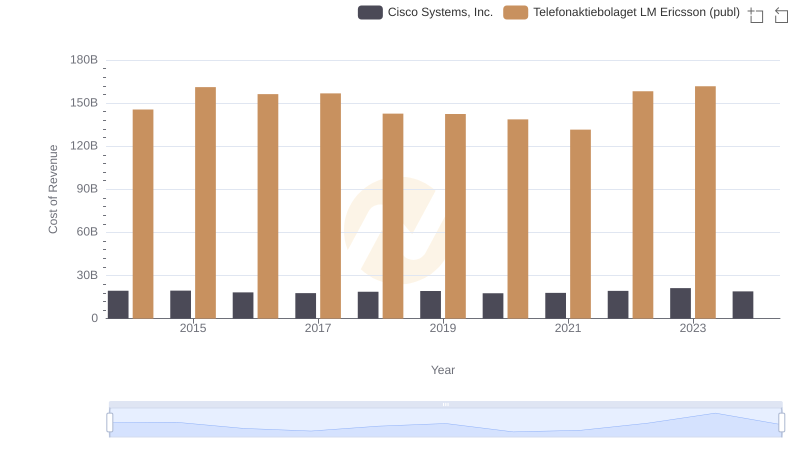
Cost of Revenue: Key Insights for Cisco Systems, Inc. and Telefonaktiebolaget LM Ericsson (publ)
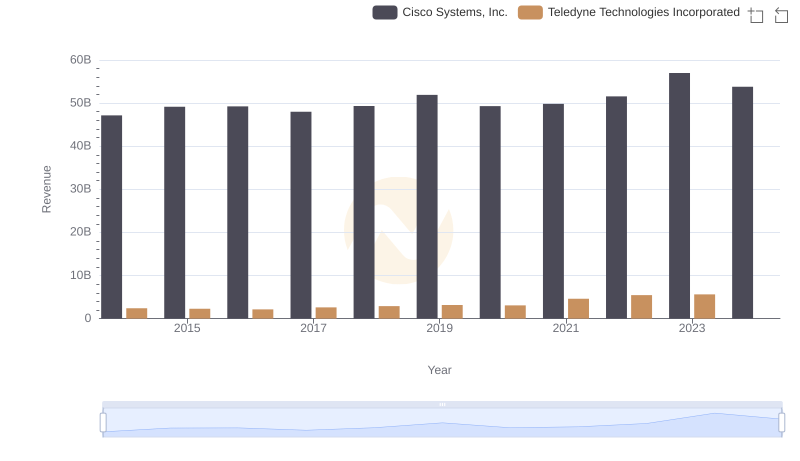
Cisco Systems, Inc. vs Teledyne Technologies Incorporated: Examining Key Revenue Metrics
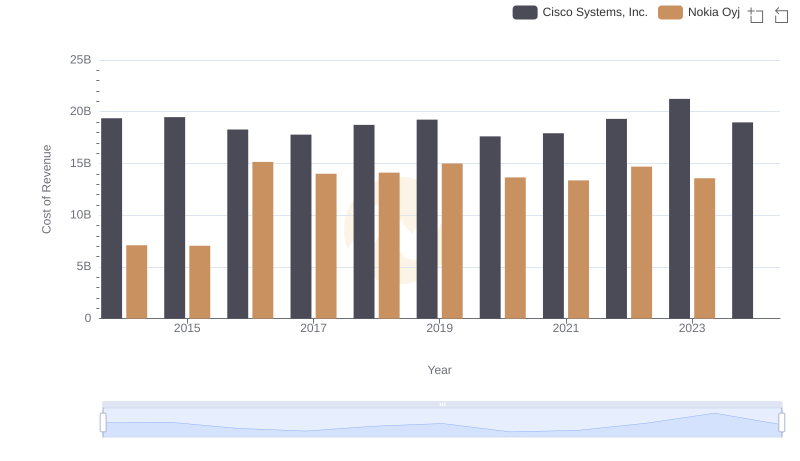
Cost Insights: Breaking Down Cisco Systems, Inc. and Nokia Oyj's Expenses
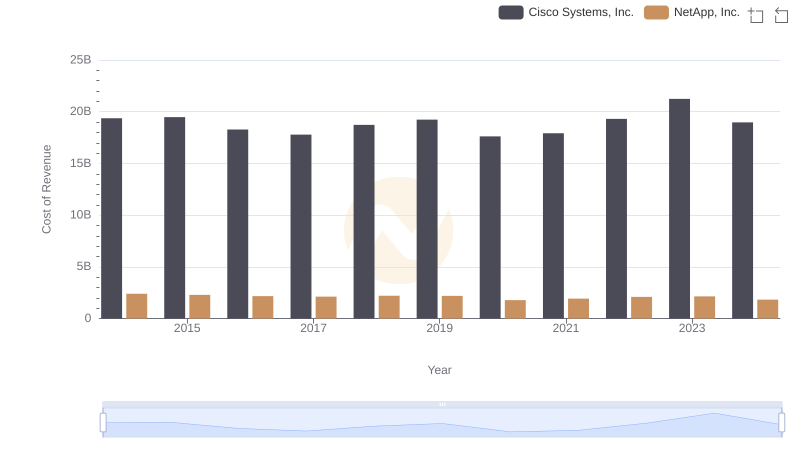
Comparing Cost of Revenue Efficiency: Cisco Systems, Inc. vs NetApp, Inc.
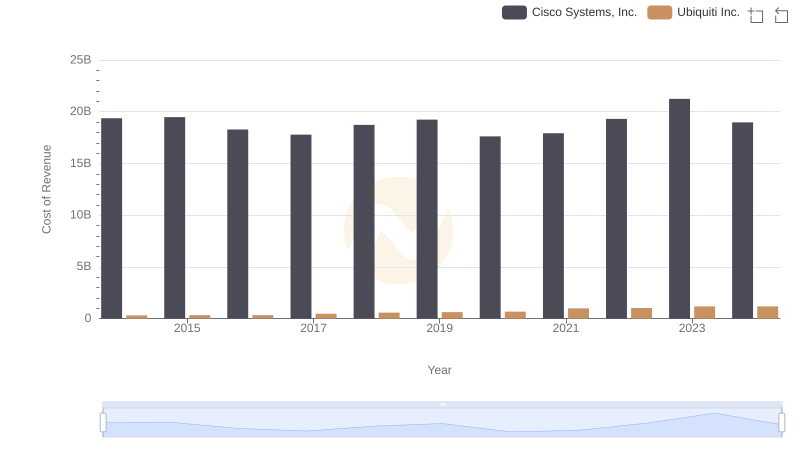
Cost of Revenue Trends: Cisco Systems, Inc. vs Ubiquiti Inc.
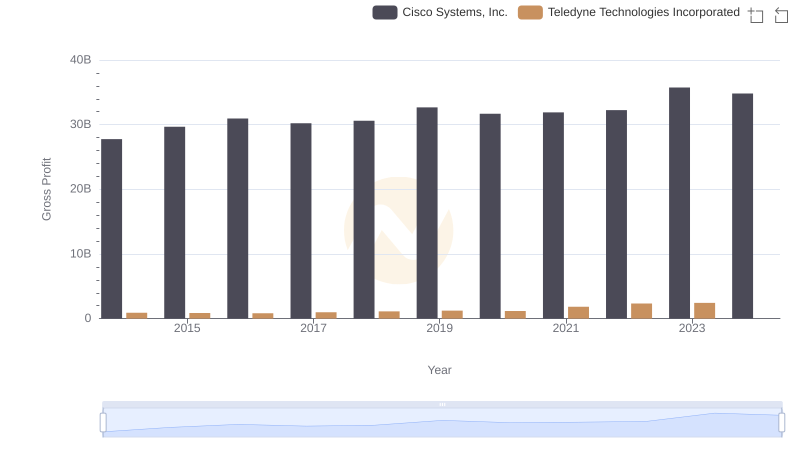
Gross Profit Trends Compared: Cisco Systems, Inc. vs Teledyne Technologies Incorporated
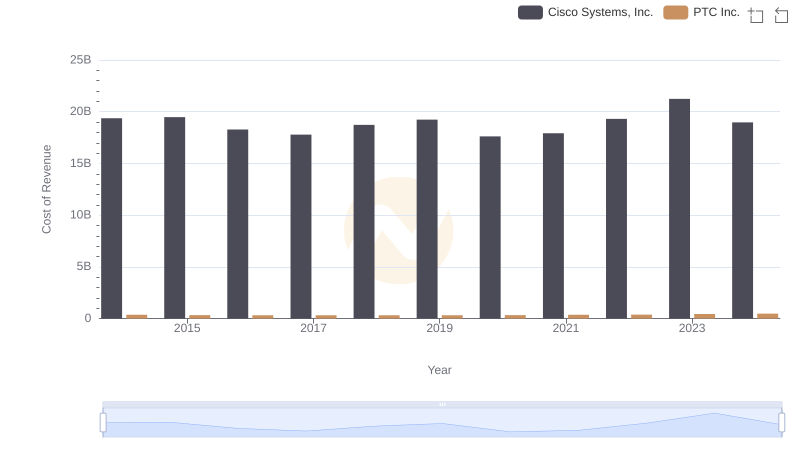
Cost Insights: Breaking Down Cisco Systems, Inc. and PTC Inc.'s Expenses
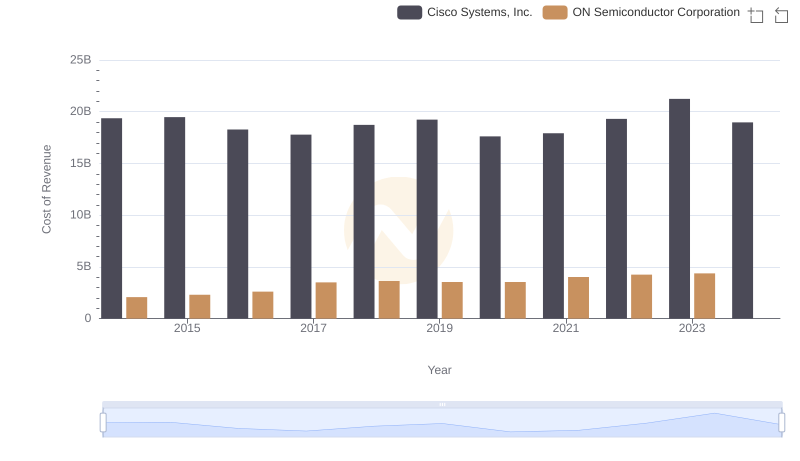
Cost of Revenue Trends: Cisco Systems, Inc. vs ON Semiconductor Corporation
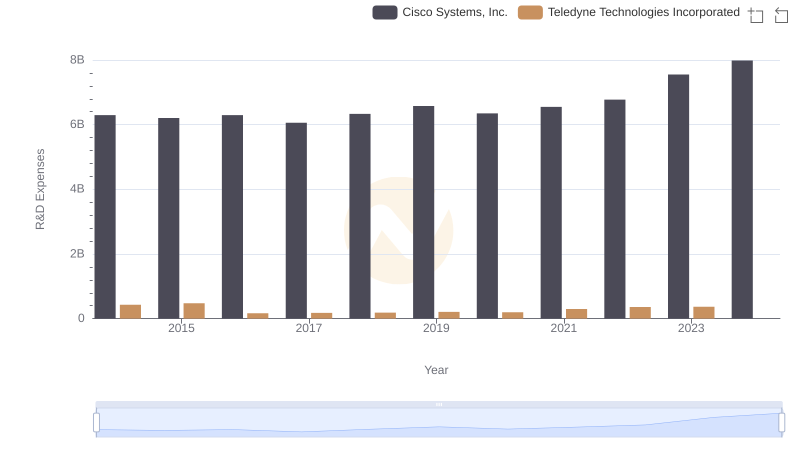
Who Prioritizes Innovation? R&D Spending Compared for Cisco Systems, Inc. and Teledyne Technologies Incorporated
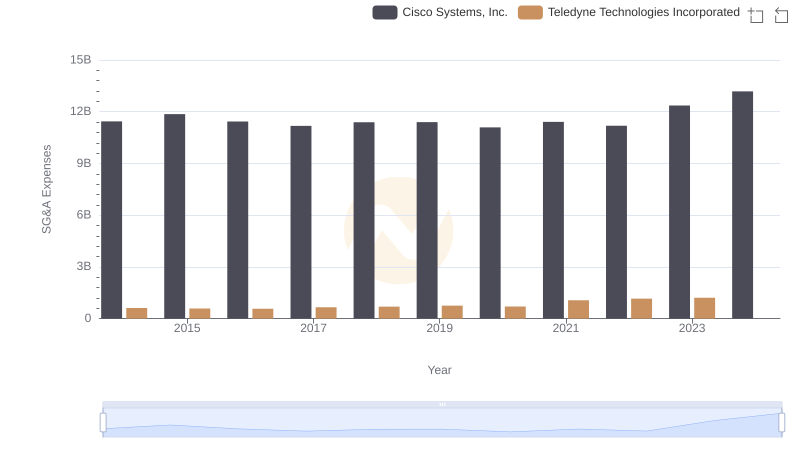
Operational Costs Compared: SG&A Analysis of Cisco Systems, Inc. and Teledyne Technologies Incorporated
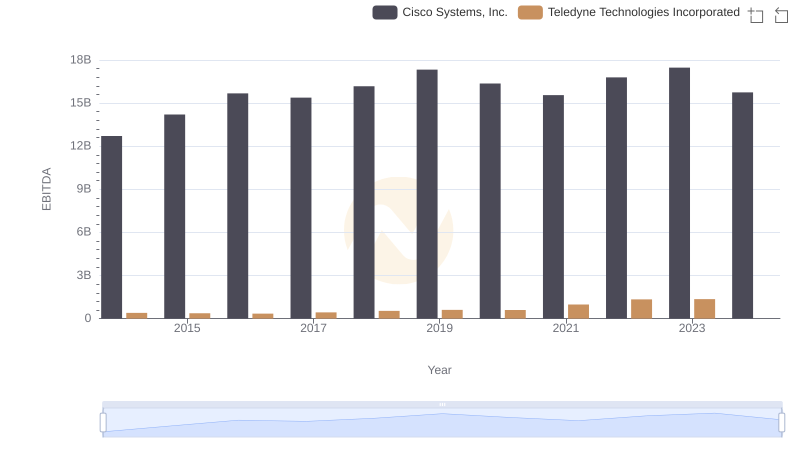
Cisco Systems, Inc. and Teledyne Technologies Incorporated: A Detailed Examination of EBITDA Performance