| __timestamp | Cisco Systems, Inc. | NetApp, Inc. |
|---|---|---|
| Wednesday, January 1, 2014 | 47142000000 | 6325100000 |
| Thursday, January 1, 2015 | 49161000000 | 6122700000 |
| Friday, January 1, 2016 | 49247000000 | 5546000000 |
| Sunday, January 1, 2017 | 48005000000 | 5519000000 |
| Monday, January 1, 2018 | 49330000000 | 5911000000 |
| Tuesday, January 1, 2019 | 51904000000 | 6146000000 |
| Wednesday, January 1, 2020 | 49301000000 | 5412000000 |
| Friday, January 1, 2021 | 49818000000 | 5744000000 |
| Saturday, January 1, 2022 | 51557000000 | 6318000000 |
| Sunday, January 1, 2023 | 56998000000 | 6362000000 |
| Monday, January 1, 2024 | 53803000000 | 6268000000 |
Unveiling the hidden dimensions of data
In the ever-evolving tech industry, revenue generation is a key indicator of a company's market position and growth potential. From 2014 to 2024, Cisco Systems, Inc. consistently outperformed NetApp, Inc. in annual revenue. Cisco's revenue peaked in 2023, reaching approximately 57 billion USD, marking a 21% increase from 2014. In contrast, NetApp's revenue showed a modest growth of around 1% over the same period, peaking at 6.4 billion USD in 2023.
Cisco's dominance is evident, with its revenue consistently being over 8 times that of NetApp's. This trend highlights Cisco's robust market strategy and its ability to adapt to technological advancements. As we look to the future, the question remains: Can NetApp close the gap, or will Cisco continue to lead the charge in revenue generation?

Cisco Systems, Inc. vs Telefonaktiebolaget LM Ericsson (publ): Examining Key Revenue Metrics
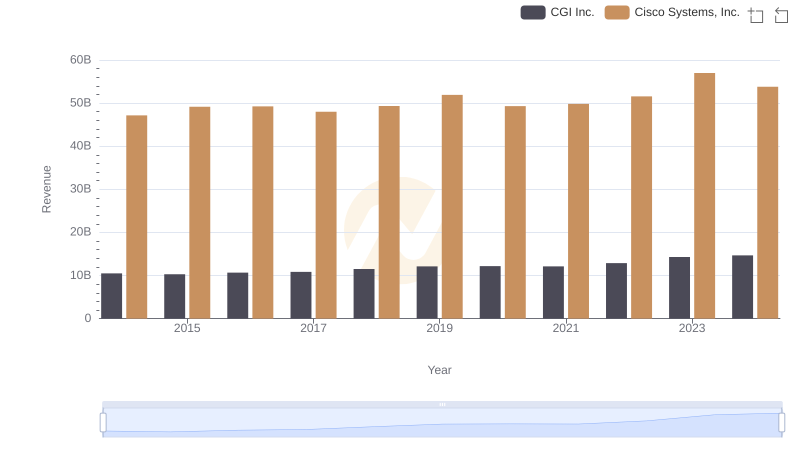
Revenue Insights: Cisco Systems, Inc. and CGI Inc. Performance Compared
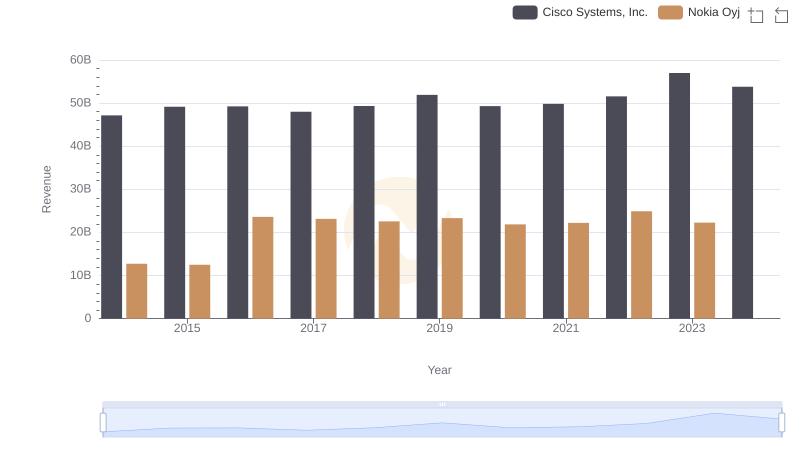
Cisco Systems, Inc. vs Nokia Oyj: Examining Key Revenue Metrics
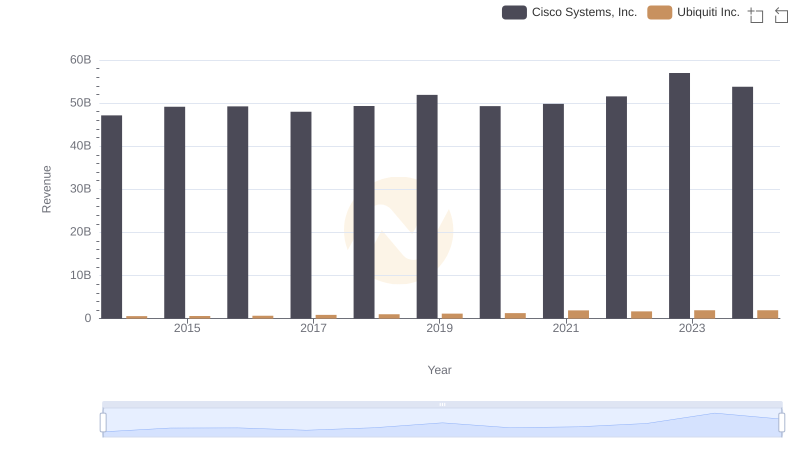
Revenue Insights: Cisco Systems, Inc. and Ubiquiti Inc. Performance Compared
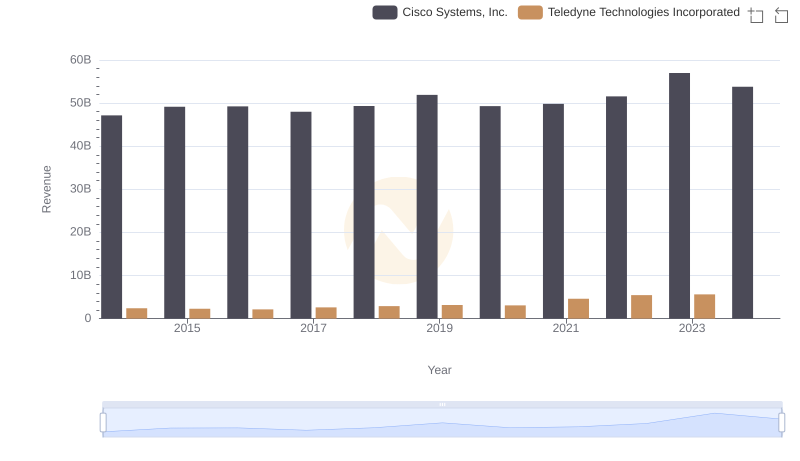
Cisco Systems, Inc. vs Teledyne Technologies Incorporated: Examining Key Revenue Metrics
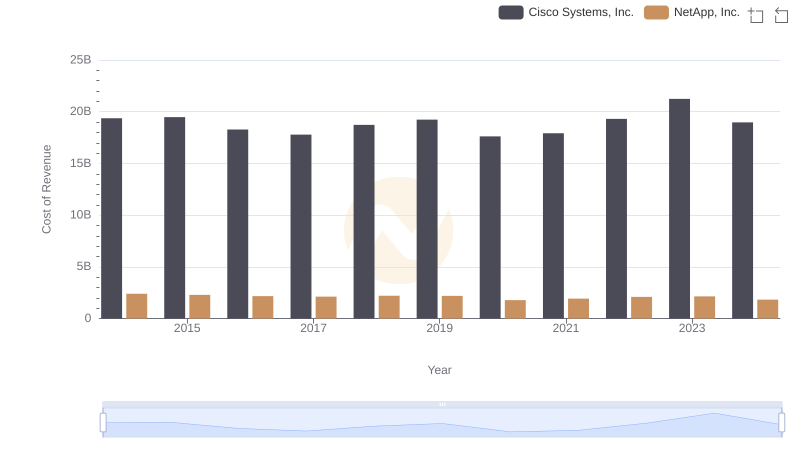
Comparing Cost of Revenue Efficiency: Cisco Systems, Inc. vs NetApp, Inc.
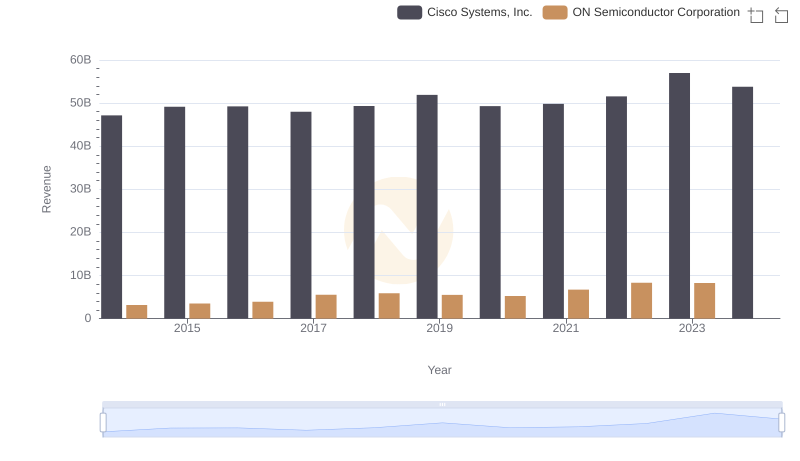
Cisco Systems, Inc. vs ON Semiconductor Corporation: Annual Revenue Growth Compared
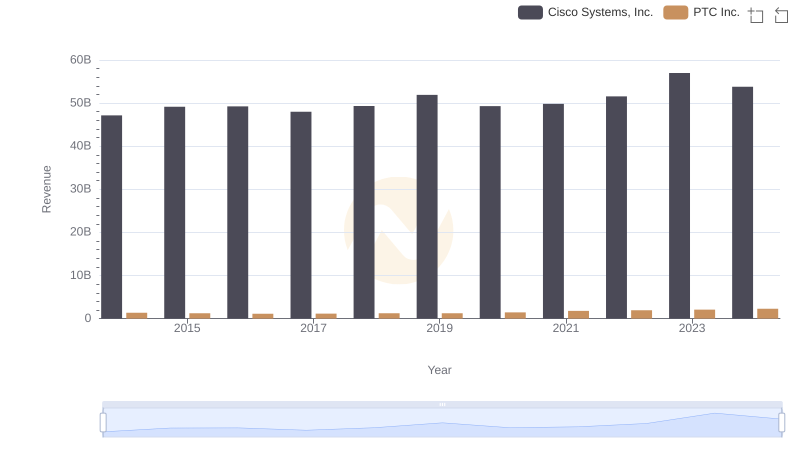
Cisco Systems, Inc. and PTC Inc.: A Comprehensive Revenue Analysis
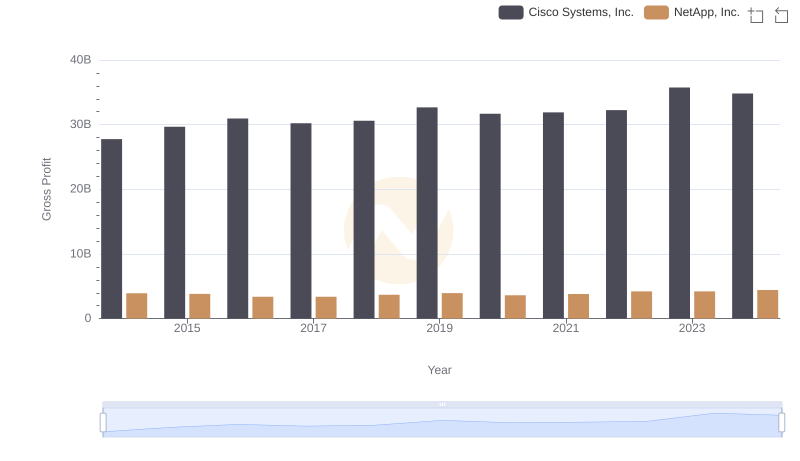
Gross Profit Analysis: Comparing Cisco Systems, Inc. and NetApp, Inc.
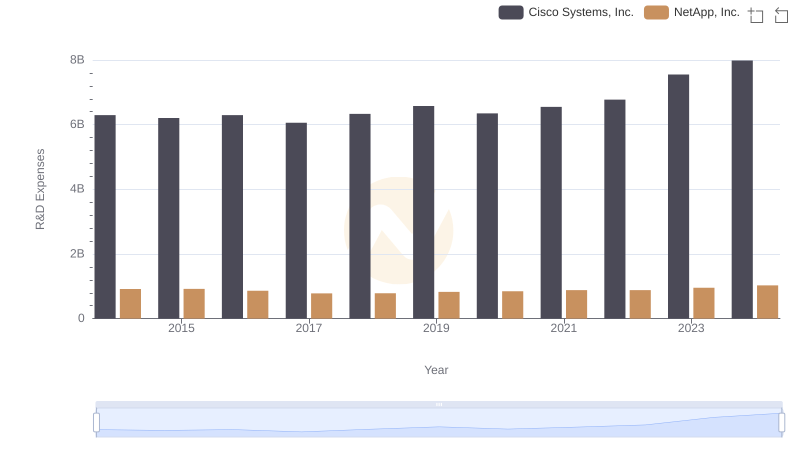
R&D Spending Showdown: Cisco Systems, Inc. vs NetApp, Inc.
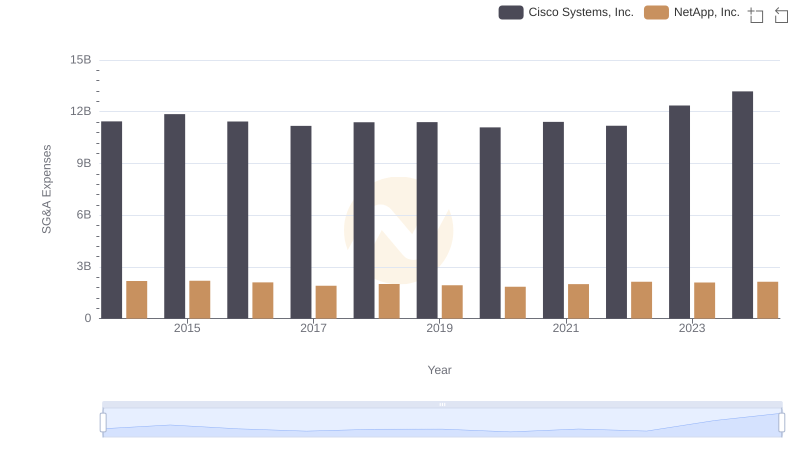
Cost Management Insights: SG&A Expenses for Cisco Systems, Inc. and NetApp, Inc.
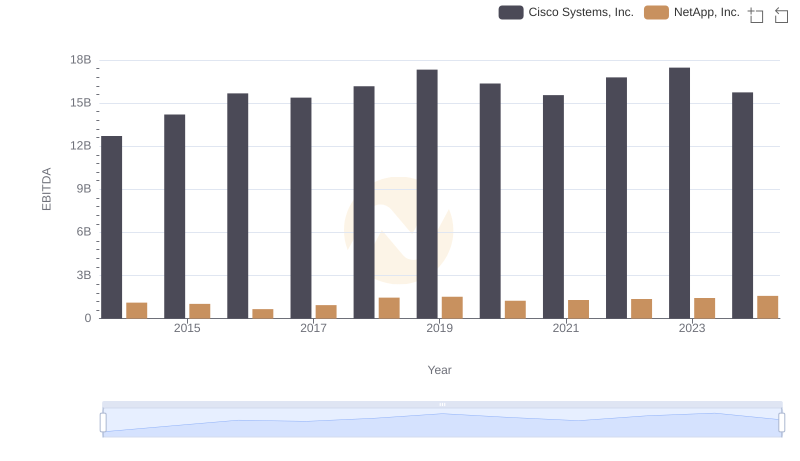
A Side-by-Side Analysis of EBITDA: Cisco Systems, Inc. and NetApp, Inc.